
evidence / Self-refutation & honesty
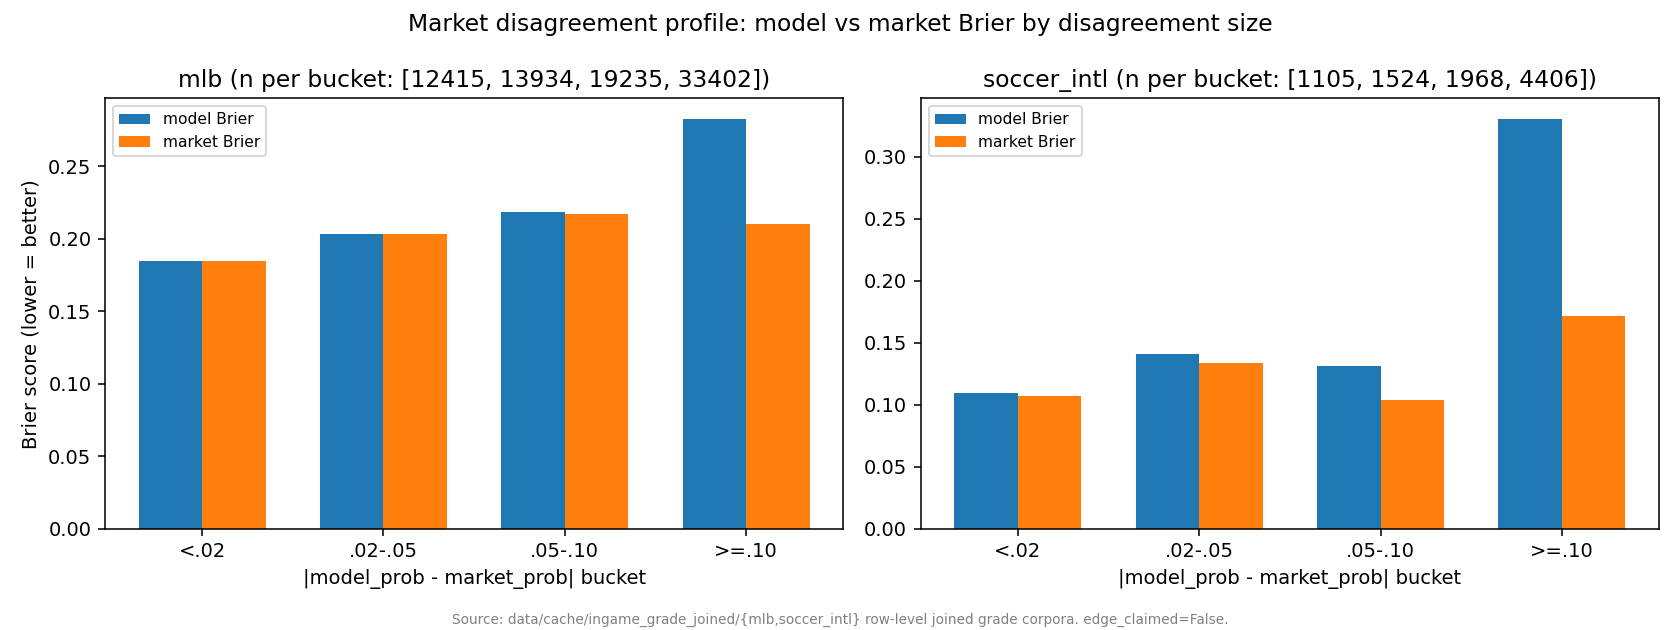
When the market out-forecasts us -- measured, bucketed, and published
A calibrated forecaster earns trust by publishing where it loses, not just where it wins. This page does exactly that: it measures when the market out-forecasts our model, bucketed by how far apart the two disagree, and tracks that gap over calendar time. Every number below is quoted verbatim from committed JSON. The single truth-source for any figure is docs/JOB_EVIDENCE_PACKET.md. No dollar/ROI/edge is claimed anywhere -- both analytics carry edge_claimed: false.
strongest single receipt
the claim
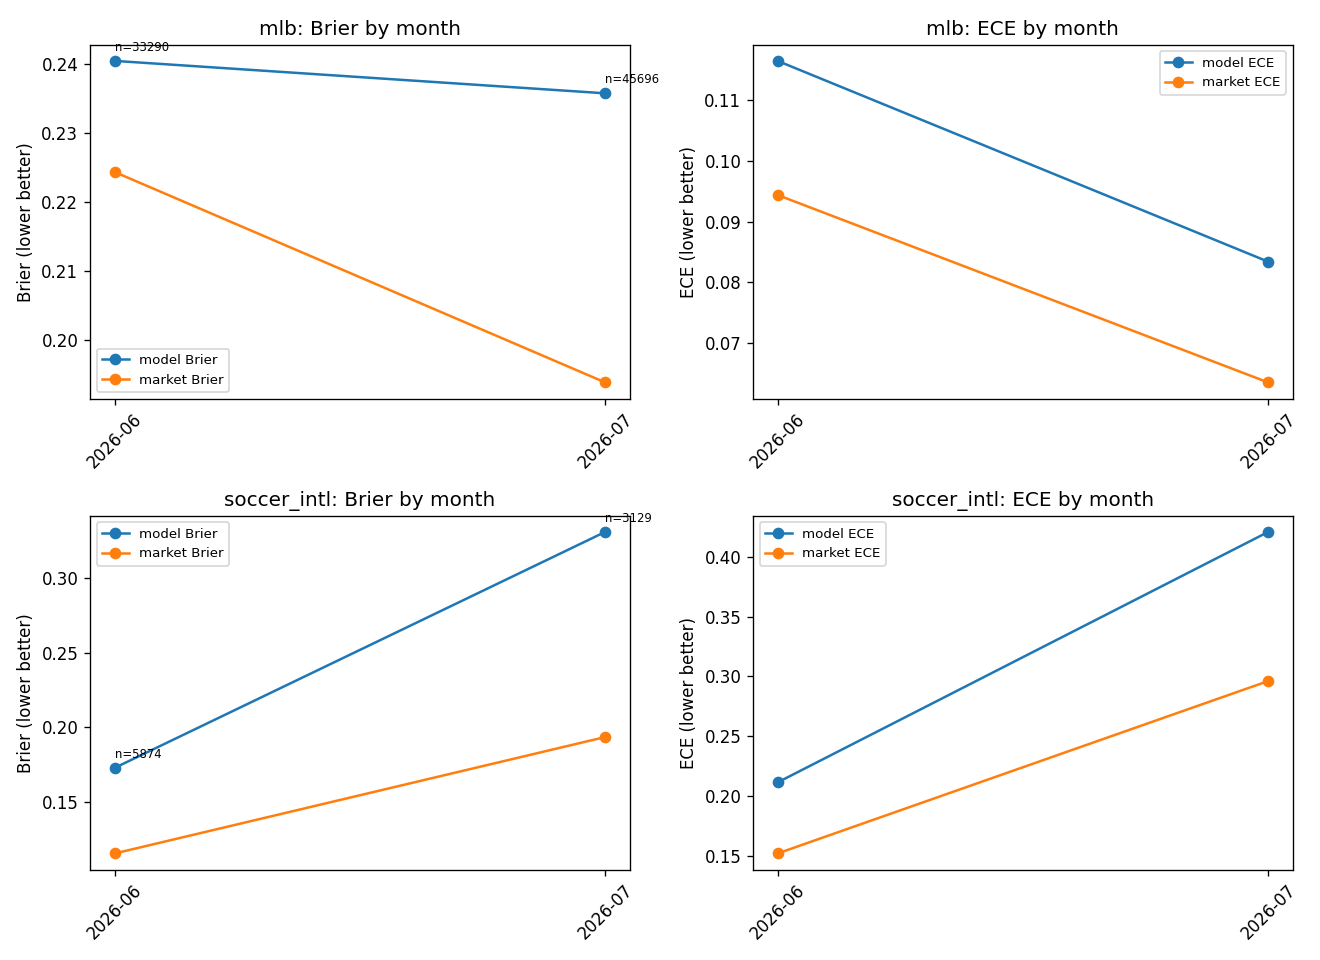
We do not hide the cases where the market beats us. We instrument them. Two published analytics answer two honest questions:
1. When our model disagrees with the market, who is usually right? 2. Is that relationship stable over calendar time, or drifting?
The answer to both, stated plainly, is a market-efficiency confirmation: at the largest disagreements the market is usually right, and across every available month the market's Brier and ECE beat the model's. That is the correct result for an efficient market, and the credibility signal is that we measure and publish it rather than quoting only the buckets where we happen to look good.
cited artifacts
| committed artifact |
|---|
| scripts/platformkit/analytics_showcase/out/market_disagreement_profile.json |
| scripts/platformkit/analytics_showcase/out/calibration_over_time.json |
why this matters
The field standard for a forecaster is calibration, and the honest test of calibration is whether you publish your losses. These two analytics are built to surface exactly the cases where the market out-forecasts us -- the largest-disagreement bucket and the worst month -- and they say so in plain numbers. That is the same discipline behind the rest of this repo: measure against a real market baseline, keep the negative result, and never convert prediction quality into an edge claim.
reproduce
# Disagreement profile (also: --check for a self-verifying assertion pass)
python -m scripts.platformkit.analytics_showcase.market_disagreement_profile

# Monthly calibration drift
python -m scripts.platformkit.analytics_showcase.calibration_over_timeThis site reports calibration and sharpness only, never a dollar edge, ROI, or bankroll result. An honest null is a success.