Against the market baseline, the skill score is negative everywhere
mlb: BSS(model vs market) in [-0.113, -0.092] -- model does not beat the closing reference forecast; BSS(model vs climatology) in [+0.081, +0.621] (BSS>0 means it beats that baseline). soccer_intl: BSS(model vs market) in [-1.171, -0.469...
Data integrity
These MLB/soccer numbers are revision 2, computed on the segment-clean corpus (2026-09-16). Revision 1 values are withdrawn and kept in the regeneration receipt. Segmentation excluded 51,635 of the 78,986 MLB ticks (65.4 percent); the specifically identified label mismatches were a smaller 27,076 (34.3 percent).
- brier_skill_scores
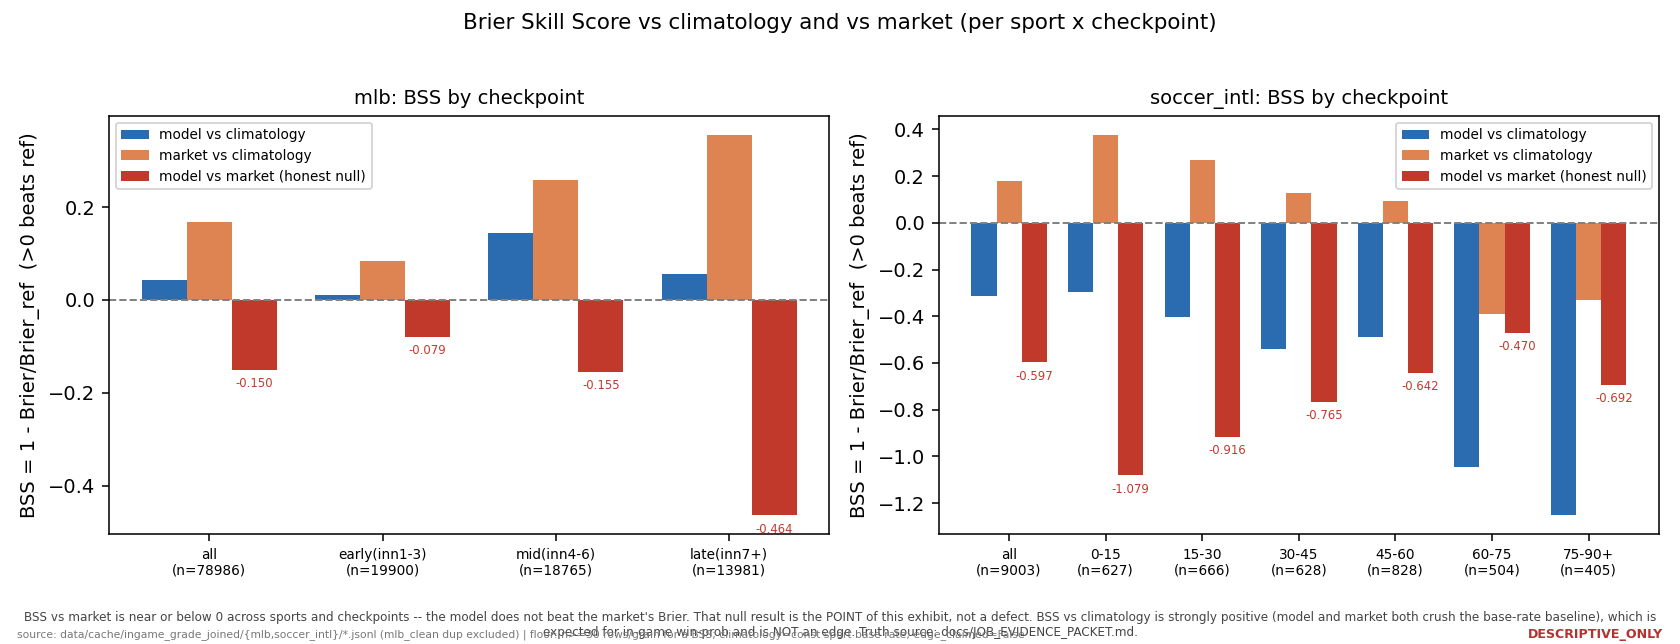
How to read this figure
Read each cell's BSS: above 0 beats the baseline, below 0 loses to it; compare the vs-market column (the hard test) against the vs-climatology column (the easy one).
Continue with the data
Open the interactive analysis: Brier skill score by sport and game phaseWhat it means
Brier Skill Score is 1 minus Brier over a reference Brier; positive means you beat the reference. Against climatology (a constant base-rate guess) the MLB model scores clearly positive (+0.3327), as any real in-game model should; on the far smaller soccer corpus it is negative (-0.8569), meaning the model there does not even beat the base rate. Against the market it is negative in every sport and every checkpoint -- the market's Brier is lower. This is reported plainly, not hidden.
Caveats and confounds
The most negative MLB cell is mid(inn4-6) at -0.1133, and late(inn7+) is now the least negative at -0.0918; these are revision-2 figures measured on the segment-clean corpus (27,351 MLB rows, 4,265 soccer rows).