The market's calibration lead over the model narrows as the game unfolds
In MLB, the market's Brier stays below the model's at every inning checkpoint, but the gap narrows as the game progresses -- market_minus_model_brier goes from -0.0121 in the 1st inning to -0.001 by the 9th.
Data integrity
These MLB/soccer numbers are revision 2, computed on the segment-clean corpus (2026-09-16). Revision 1 values are withdrawn and kept in the regeneration receipt. Segmentation excluded 51,635 of the 78,986 MLB ticks (65.4 percent); the specifically identified label mismatches were a smaller 27,076 (34.3 percent).
- info_arrival_curve
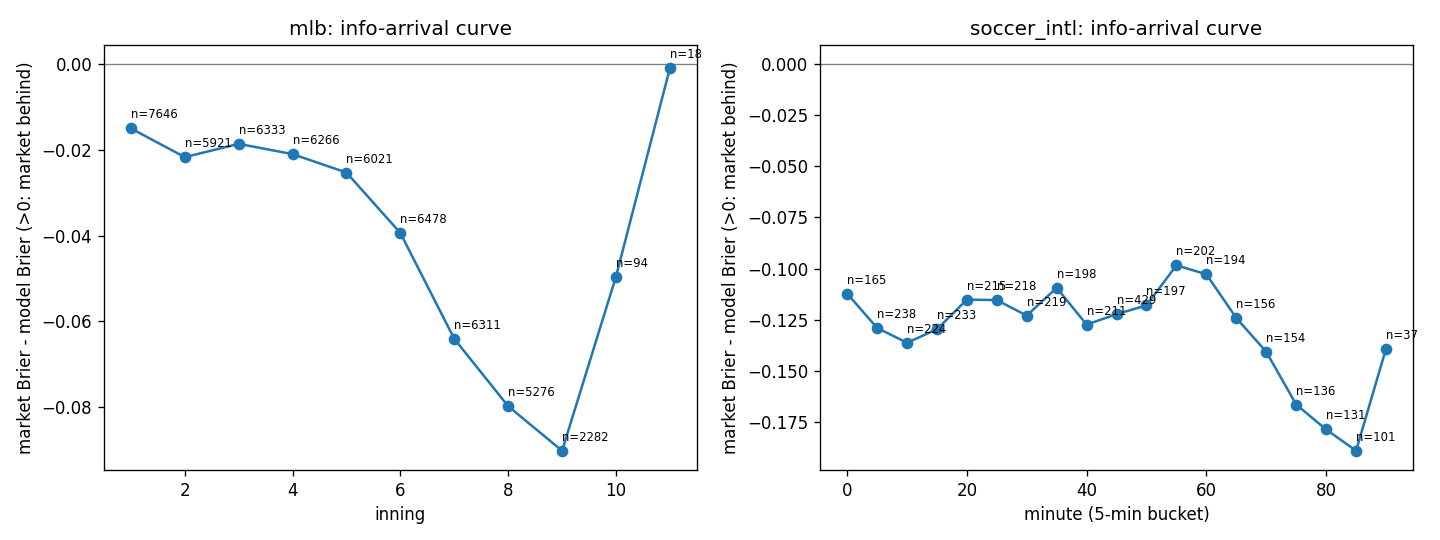
How to read this figure
One point per game-time checkpoint; market_minus_model_brier below zero means the market scored a lower (better) Brier than the model at that stage, and a more-negative value means a larger calibration gap.
Continue with the data
Open the interactive analysis: Model and market Brier by game checkpointWhat it means
A negative market-minus-model Brier means the market is the better-calibrated forecaster. On the segment-clean corpus the market leads at every checkpoint, and the lead is largest in the middle innings (-0.0353 in the 2nd) and smallest by the 9th, where both forecasters are nearly resolved. The earlier reading -- a gap that widened to -0.0902 by the 9th -- was measured on mixed-game files and does not survive segmentation.
Caveats and confounds
Novelty verdict is INCREMENTAL -- the same paired model/market/outcome Brier instrument appears in prior work; do not claim first-ever. Checkpoints thin out late (9th-inning n 1110) and the extra-inning checkpoints are tiny (n 46 and n 6), so read the tail cautiously.