Browse › Market Disagreement Profile
Analytics module · as of
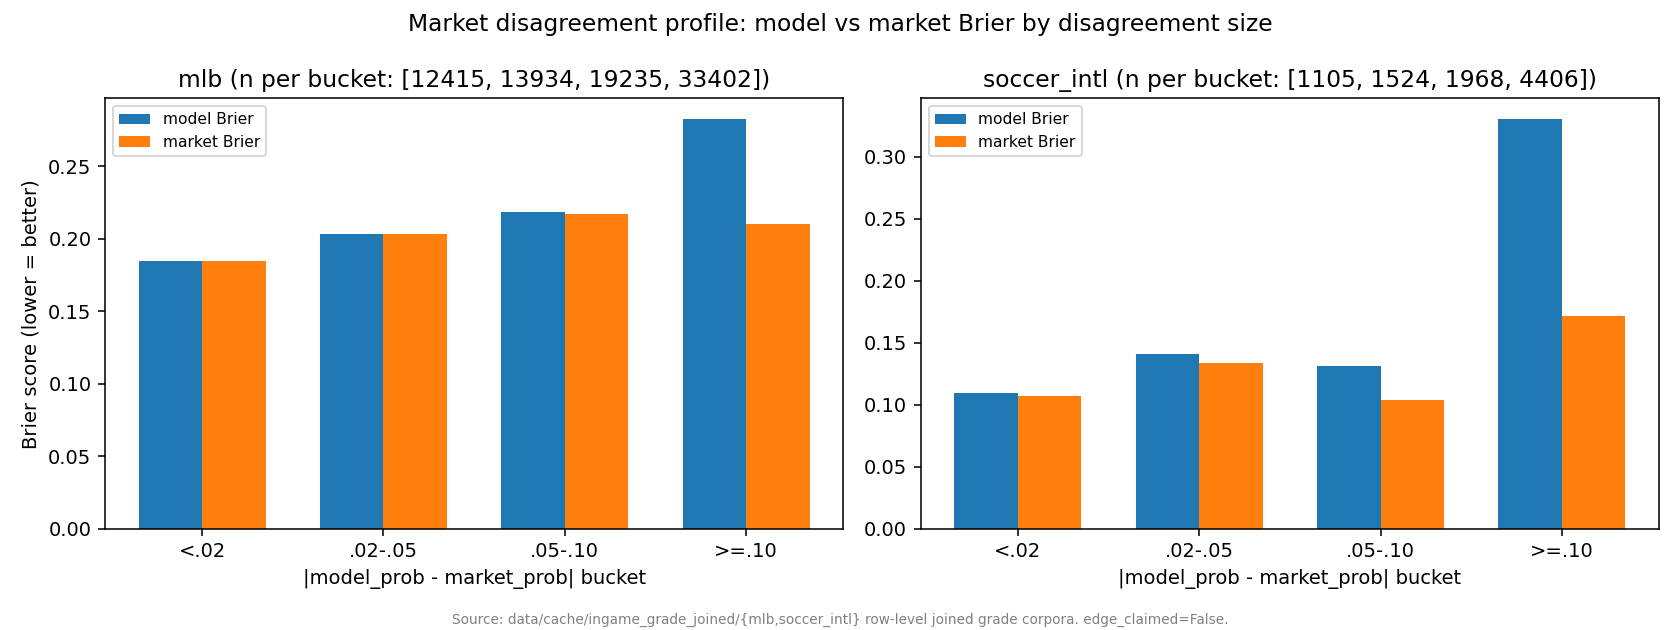
When the model disagrees most with the market, the market is right
mlb: at largest disagreement (>=.10, n=33402), market usually right (model_closer_rate=0.377, model_brier=0.2827 vs market_brier=0.2103). soccer_intl: at largest disagreement (>=.10, n=4406), market usually right (model_closer_rate=0.215...
confirmednull (a finding)not testabledescriptivepending
Market Disagreement Profile
What it means
Bucketing predictions by how far the model sits from the market is a direct test of who is right when they disagree. At small disagreements the two are effectively tied. But every step up in disagreement, the model gets worse relative to the market -- at the widest gap it lands closer to the truth only about 38% of the time. Large model-market disagreements are the model being wrong, not finding an edge.
Caveats & confounds
The same pattern holds in soccer (model_closer_rate 0.2152 at the widest gap), so it is not an MLB quirk -- though both rest on in-game corpora only.
Method. bucket rows by |model_prob - market_prob|; per-bucket model/market Brier + model_closer_rate
Ask Scout about this