Price moves overshoot in MLB, undershoot in soccer
After an in-game price move, MLB prices land a few points above the eventual outcome (moved-to-minus-outcome +0.03 to +0.0642 across move sizes), while in soccer the moved-to price sits well below it (-0.2671 to -0.3184).
Data integrity
These MLB/soccer numbers are revision 2, computed on the segment-clean corpus (2026-09-16). Revision 1 values are withdrawn and kept in the regeneration receipt. Segmentation excluded 51,635 of the 78,986 MLB ticks (65.4 percent); the specifically identified label mismatches were a smaller 27,076 (34.3 percent).
- market_overreaction
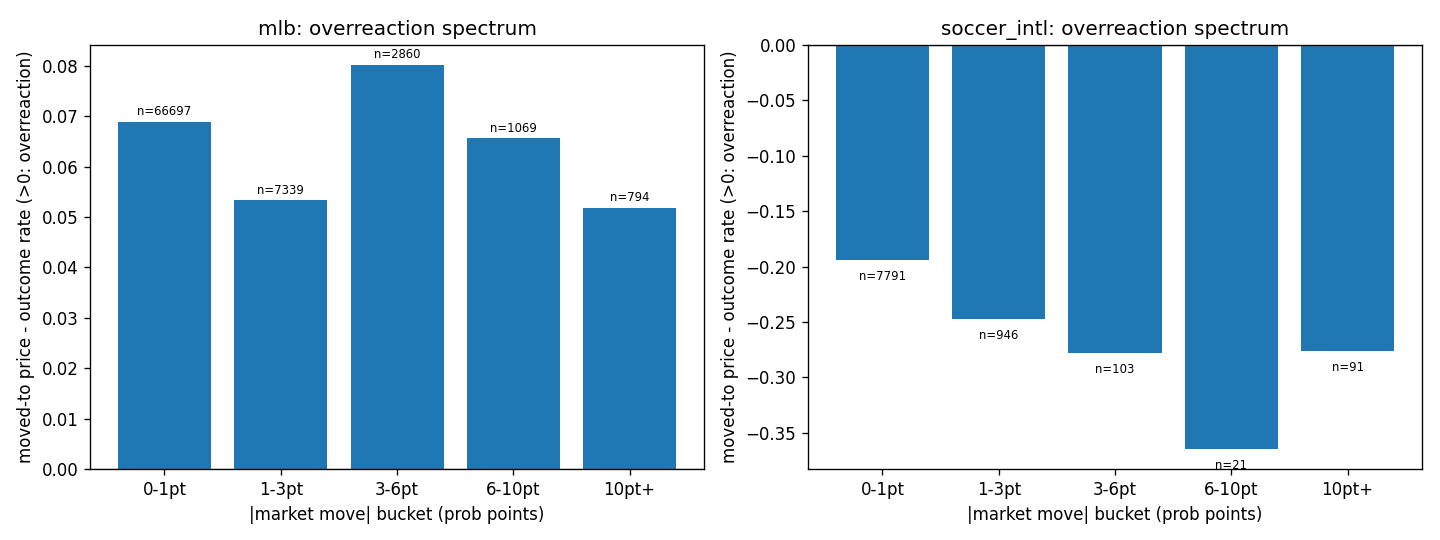
How to read this figure
moved_to_minus_outcome is the moved-to price minus the realized outcome rate; positive means the move overshot, negative means it undershot.
Published operands
Moved-to price and outcome rate
The signed difference is derived from the two preceding columns and shown beside the published field.
| Sport | Bucket | n | Moved-to price | Outcome rate | Price minus outcome |
|---|---|---|---|---|---|
| MLB | 0-1pt | 19,044 | 52.38% | 49.36% | +3.02 pp (published +3.02 pp) |
| MLB | 1-3pt | 4,763 | 52.51% | 49.51% | +3.00 pp (published +3.00 pp) |
| MLB | 3-6pt | 2,029 | 52.06% | 45.64% | +6.42 pp (published +6.42 pp) |
| MLB | 6-10pt | 782 | 51.79% | 47.06% | +4.73 pp (published +4.73 pp) |
| MLB | 10pt+ | 555 | 49.99% | 46.31% | +3.68 pp (published +3.68 pp) |
| International soccer | 0-1pt | 3,564 | 42.08% | 70.45% | -28.37 pp (published -28.37 pp) |
| International soccer | 1-3pt | 541 | 34.56% | 61.28% | -26.72 pp (published -26.71 pp) |
| International soccer | 3-6pt | 65 | 29.50% | 60.77% | -31.27 pp (published -31.27 pp) |
| International soccer | 6-10pt | 11 | 26.32% | 54.55% | -28.23 pp (published -28.23 pp) |
| International soccer | 10pt+ | 57 | 43.60% | 75.44% | -31.84 pp (published -31.84 pp) |
Observation dates, snapshot intervals, and independent-game counts are not published in this artifact. International soccer's 6-10pt bucket has n=21 and should be read as limited support.
What it means
This is the classic price-move-versus-outcome test, bucketed by move size. In MLB, wherever the price moved to, the outcome came in a few points lower -- a small overshoot. In soccer the moved-to price sat well below the eventual outcome -- an undershoot, and a larger one on the segment-clean corpus than the earlier reading showed. The directions differ by sport, and the effect is one the finance literature already documents.
Caveats and confounds
The authors label this INCREMENTAL, not novel -- it replicates Moskowitz-style reversion tests -- and the soccer buckets above one point are now tiny (the 6-10pt bucket is n=11) and unreliable.