Browse › Mechanism Survival
Analytics module · as of
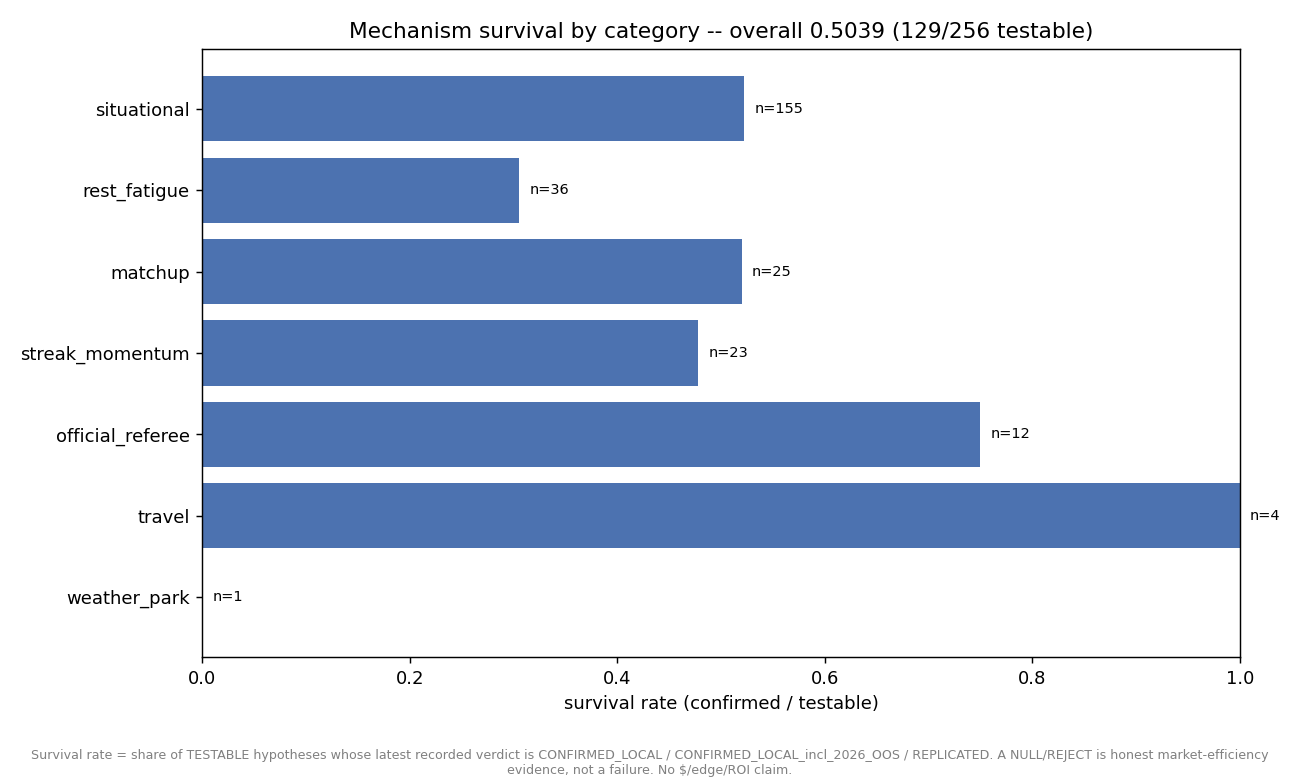
Mechanism survival: about half of testable ideas hold up
Survival rate = share of TESTABLE hypotheses whose latest recorded verdict is CONFIRMED_LOCAL / CONFIRMED_LOCAL_incl_2026_OOS / REPLICATED. A NULL/REJECT is honest market-efficiency evidence, not a failure. No $/edge/ROI claim.
confirmednull (a finding)not testabledescriptivepending
Mechanism Survival
What it means
Of 287 hypotheses in the four sport ledgers, 256 were testable and 129 confirmed on their latest verdict, a 50.4% survival rate. Survival splits by sport: NBA holds up best at 0.56 while MLB is weakest at 0.3974.
Caveats & confounds
Category-level rates on tiny samples are not durable: rest_fatigue survives at just 0.3056 and weather_park at 0.0 on a single testable row.
Ask Scout about this