Research paper
Where forecasts match outcomes
Reliability of CourtVision win forecasts against the closing reference, by sport and by game state
Abstract
We measured how closely CourtVision's model win probabilities and the devigged market close match observed outcomes, in aggregate and by game state, on two segment-clean in-game corpora: MLB (27,351 rows, 178 games) and international soccer (4,265 rows, 27 games). A game-cluster bootstrap (1000 resamples of game_id) on 10 probability bins leaves none of the ten MLB market bins with a gap interval excluding zero (0 of 10), against 3 of 10 for the MLB model, worst at 0.2-0.3: predicted 0.2449, observed 0.1065 (n=1,774 rows, 69 games, gap -0.1384, 95 percent CI -0.2157 to -0.0448). The model's top bin is no longer among them: at 0.9-1.0 it predicts 0.9516 against an observed 0.9798 (n=1,437, gap 0.0282, CI -0.0063 to 0.0488, not significant). Soccer has many significant bins on both sides (model 8 of 9 eligible, market 7 of 9) on only 27 games, so no sport-level verdict follows. The n-weighted expected calibration error the artifact publishes is all-state, not late-game: 0.0494 model against 0.0397 market, over the 26,683 MLB rows that carry a game-state field. Status: revision 1's two headline MLB misses were withdrawn on 2026-09-16 as artifacts of a corpus join defect, and every figure here is a population change on a smaller corpus, not a sharper model.
1 Question
How often does a CourtVision win forecast land close to what actually happened, and does that reliability hold once you condition on when in the game the forecast was made? This paper answers both for the two sports with graded in-game corpora, putting every model number next to a market reference number without assuming a shared bin label means the same rows.
This is a calibration and reliability exercise only: it reports whether a stated probability matches the observed frequency of the outcome, and not whether acting on either source's price would have produced a return.
2 Data and definitions
calibration_stability.json holds a cluster-bootstrap reliability exhibit built from data/cache/ingame_grade_joined/{mlb_segmented,soccer_intl_segmented}, dated 2026-09-16. For MLB it covers 27,351 graded rows across 178 games; for soccer_intl, 4,265 rows across 27 games. Each sport carries two independently built sets of 10 probability bins, one for model_prob and one for market_prob (the devigged closing reference). Each bin records n, n_games, mean_p, mean_y, gap (mean_y minus mean_p, so a positive gap means the outcome landed above the forecast), a bootstrapped 95 percent CI on the gap, and whether that CI excludes 0.
state_conditioned_calibration.json buckets the same rows by time_bucket (game phase) crossed with prob_bucket (a coarser 5-band split), again separately per source. For MLB it starts from 27,351 records across 178 files and drops 668 with no game-state field; for soccer_intl, 4,265 across 27 files less 882. Both the artifact and the site manifest now stamp it as_of 2026-09-16, where revision 1 published no date.
The drop rate is the sharpest sign of what segmentation did. On the joined corpus 26,340 of 78,986 MLB rows carried no game-state field; here 668 of 27,351 do, so the state-conditioned view now covers 26,683 of 27,351 MLB rows rather than two thirds of them.
Both artifacts skip mlb_clean, a byte-identical duplicate of the mlb corpus, so the same games are not counted twice.
3 Method
The aggregate bins are tested with a cluster bootstrap: resample game_id (not individual rows) with replacement 1,000 times, rebuild the 10-bin curve, and take the 2.5th and 97.5th percentile of the gap as the 95 percent CI. Resampling whole games matters because rows inside one game are correlated, and it matters more here than in revision 1 because the game count fell from 227 to 178.
gap = mean_y - mean_p; 95% CI from 1000 game-cluster bootstrap resamples; significant = (CI excludes 0)
A bin label is shared between model and market, but the two bins are not paired: each side's rows are grouped by that side's own probability. The MLB model's 0.9-1.0 bin holds n=1,437 across 61 games against the market's n=3,555 across 83, and MLB's late(inn7+), 0.8-1 cell holds n=2,369 for the model against n=2,666 for the market. Differing counts establish that the two selections are not identically selected; they do not establish that the two sets are disjoint.
4 Results
Aggregate reliability, MLB (27,351 rows, 178 games, as of 2026-09-16): the model's overall Brier is 0.1668 and the market's is 0.1510, a difference of 0.0158. Of the model's 10 bins, 3 have a gap CI excluding 0; of the market's 10, none do -- the one aggregate MLB statement that reads the same in both revisions.
| Bin | Source | n (rows) | n (games) | Mean forecast | Observed rate | Gap | 95% gap CI | Significant |
|---|---|---|---|---|---|---|---|---|
| 0.0-0.1 | market | 3233 | 83 | 0.0492 | 0.0213 | -0.0278 | -0.0484 to 0.0055 | no |
| 0.0-0.1 | model | 2072 | 86 | 0.0513 | 0.0632 | 0.0119 | -0.0366 to 0.0821 | no |
| 0.1-0.2 | market | 2344 | 87 | 0.1481 | 0.1212 | -0.0269 | -0.1103 to 0.0943 | no |
| 0.1-0.2 | model | 1900 | 73 | 0.1557 | 0.0458 | -0.1099 | -0.1530 to -0.0456 | yes |
| 0.2-0.3 | market | 1876 | 90 | 0.2479 | 0.1594 | -0.0885 | -0.1720 to 0.0290 | no |
| 0.2-0.3 | model | 1774 | 69 | 0.2449 | 0.1065 | -0.1384 | -0.2157 to -0.0448 | yes |
| 0.3-0.4 | market | 1526 | 98 | 0.3508 | 0.2366 | -0.1143 | -0.2202 to 0.0024 | no |
| 0.3-0.4 | model | 2217 | 80 | 0.3583 | 0.2350 | -0.1232 | -0.2303 to 0.0139 | no |
| 0.4-0.5 | market | 2703 | 127 | 0.4530 | 0.3455 | -0.1075 | -0.2320 to 0.0314 | no |
| 0.4-0.5 | model | 3859 | 100 | 0.4581 | 0.3713 | -0.0867 | -0.2195 to 0.0512 | no |
| 0.5-0.6 | market | 4129 | 140 | 0.5500 | 0.4933 | -0.0566 | -0.1618 to 0.0595 | no |
| 0.5-0.6 | model | 5636 | 114 | 0.5433 | 0.5520 | 0.0087 | -0.1026 to 0.1217 | no |
| 0.6-0.7 | market | 2957 | 117 | 0.6490 | 0.6821 | 0.0331 | -0.0870 to 0.1375 | no |
| 0.6-0.7 | model | 4026 | 95 | 0.6469 | 0.6426 | -0.0043 | -0.1475 to 0.1340 | no |
| 0.7-0.8 | market | 2579 | 100 | 0.7462 | 0.7038 | -0.0424 | -0.1801 to 0.0823 | no |
| 0.7-0.8 | model | 2024 | 70 | 0.7464 | 0.8216 | 0.0752 | -0.0376 to 0.1775 | no |
| 0.8-0.9 | market | 2449 | 88 | 0.8522 | 0.8632 | 0.0110 | -0.0835 to 0.0911 | no |
| 0.8-0.9 | model | 2406 | 81 | 0.8487 | 0.9414 | 0.0927 | 0.0298 to 0.1376 | yes |
| 0.9-1.0 | market | 3555 | 83 | 0.9494 | 0.9747 | 0.0253 | -0.0063 to 0.0448 | no |
| 0.9-1.0 | model | 1437 | 61 | 0.9516 | 0.9798 | 0.0282 | -0.0063 to 0.0488 | no |
Bin rows for model and market are independently constructed and not paired (see Method); 3 of 10 model bins and 0 of 10 market bins have a gap CI excluding 0.
The model's three significant MLB bins sit in the low and upper-middle of the range, not at the top. The largest is 0.2-0.3, predicting 0.2449 against an observed 0.1065 (n=1,774, 69 games, gap -0.1384, CI -0.2157 to -0.0448); next is 0.1-0.2, predicting 0.1557 against 0.0458 (n=1,900, 73 games, gap -0.1099); and 0.8-0.9 runs the other way, 0.8487 against 0.9414 (n=2,406, 81 games, gap 0.0927). The model is slightly too warm on longshot states and slightly too cool at 0.8-0.9.
Revision 1's headline for this table was the top bin, and it was an artifact of the join defect. On the joined corpus the model's 0.9-1.0 bin read 0.9541 predicted against 0.6632 observed over 4,753 rows, a gap of -0.2909 whose interval sat entirely below zero, reported as severe overconfidence where the model was most sure. On the segment-clean corpus the same bin reads 0.9516 against 0.9798 over 1,437 rows across 61 games, a gap of 0.0282 with a CI of -0.0063 to 0.0488 that straddles zero. A near-certain forecast attached to another game's outcome is the most expensive kind of mislabelled row, so the top bin absorbed the defect; on this corpus there is no detected miss in that bin at all.
Soccer_intl aggregate reliability (4,265 rows, 27 games): the model's Brier is 0.3325 against the market's 0.1952, and both sides show far more significant bins than MLB -- 8 of 9 eligible for the model, 7 of 9 for the market, one bin per side below the minimum-games floor. A significant interval is a departure that was detected, not a measure of how much data stands behind it. Both soccer Brier scores rose against revision 1 for a mechanical reason: the receipt records the draw share of scored ticks falling from 0.2615 to 0.1376, and a draw is cheap against a two-way probability. 27 games is a thin base for any sport-level verdict.
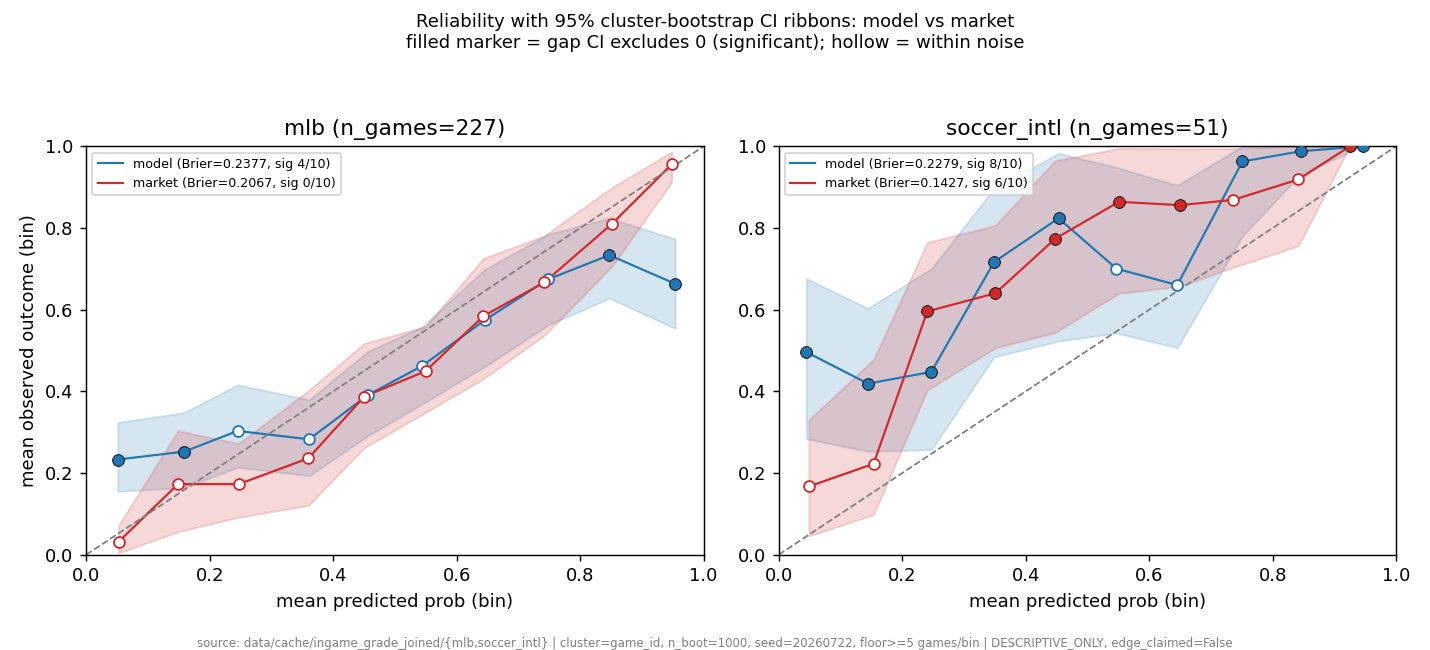
MLB and soccer_intl 10-bin reliability curves, model_prob vs market_prob, from the same game-cluster bootstrap exhibit as the table above.
Conditioning on game state narrows the question to game-phase x confidence-band cells. The n-weighted expected calibration error this artifact publishes is an all-state figure, not a late-game one: sports.mlb.model_ece_n_weighted is 0.0494 and sports.mlb.market_ece_n_weighted is 0.0397, weighted across early, mid and late cells alike, over the 26,683 MLB rows carrying a game-state field. Applying the same weighting to the published late(inn7+) cells alone gives a derived 0.0395 for the model and 0.0454 for the market, each over 7,442 rows; that pair is the n-weighted mean of the ten calibration_error values in the table below, not a field in the file.
| Prob. band | Source | n | Mean forecast | Observed rate | Calibration error |
|---|---|---|---|---|---|
| 0-0.2 | model | 2884 | 0.0784 | 0.0666 | 0.0118 |
| 0-0.2 | market | 2851 | 0.0793 | 0.0477 | 0.0316 |
| 0.2-0.4 | model | 617 | 0.2620 | 0.0843 | 0.1778 |
| 0.2-0.4 | market | 640 | 0.2760 | 0.1594 | 0.1166 |
| 0.4-0.6 | model | 820 | 0.5084 | 0.4793 | 0.0291 |
| 0.4-0.6 | market | 638 | 0.5213 | 0.3762 | 0.1452 |
| 0.6-0.8 | model | 752 | 0.7346 | 0.7779 | 0.0433 |
| 0.6-0.8 | market | 647 | 0.7098 | 0.7620 | 0.0522 |
| 0.8-1.0 | model | 2369 | 0.9101 | 0.9498 | 0.0397 |
| 0.8-1.0 | market | 2666 | 0.9206 | 0.9381 | 0.0175 |
Model and market cells at the same band are built from different row sets (see Method); n differs by source at every band.
Late-game MLB is not a sweep for either side. The model's largest late-inning miss is at 0.2-0.4, predicting 0.2620 against an observed 0.0843 over 617 rows (error 0.1778); the market's is at 0.4-0.6, 0.5213 against 0.3762 over 638 rows (0.1452). In the two best-populated bands both sides are close and small: at 0.8-1.0 the model reads 0.9101 against 0.9498 (n=2,369, error 0.0397) and the market 0.9206 against 0.9381 (n=2,666, 0.0175); at 0-0.2 the model reads 0.0784 against 0.0666 (n=2,884, 0.0118) and the market 0.0793 against 0.0477 (n=2,851, 0.0316). With no interval on any cell, the ordering between the two derived late figures is not a result.
The late, high-confidence cell was revision 1's second headline, and it was an artifact of the join defect too. On the joined corpus the model's late(inn7+), 0.8-1 cell read 0.9211 predicted against 0.6853 observed over 5,037 rows, a calibration error of 0.2357, described as the largest well-sampled miss in the exhibit. On the segment-clean corpus the cell holds 2,369 rows and reads 0.9101 against 0.9498, an error of 0.0397 -- a sixth of the withdrawn figure. The receipt singles this cell out as the largest single correction in the pass.
Soccer_intl's state-conditioned view runs the same direction at a coarser level -- all-state n-weighted calibration error of 0.3784 for the model against 0.2666 for the market -- on much less data: 882 of 4,265 rows carry no game-state field, leaving 3,383. Its worst cell has n=7 and an error of 0.7892, too little support to read as a measurement.
5 Robustness and what would falsify this
- If a later MLB corpus (more than the current 178 games) showed one of the model's three significant bins crossing zero, that bin's finding would no longer hold; the same in reverse for any market bin that started showing a significant gap.
- The two conclusions withdrawn here show what falsifies a result on this exhibit: both the -0.2909 top-bin gap and the 0.2357 late high-confidence error were measured correctly from a corpus whose labels were wrong, and both vanished when it was segmented. Every figure in this paper is exposed to the same class of failure.
- The state-conditioned late(inn7+), 0.8-1 cell has no bootstrapped CI of its own, and the aggregate 0.9-1.0 bin it lines up with is a coarser grouping, so the two are corroborating, not identical, evidence.
- Any soccer_intl claim is testable against more games: the current counts (model 8 of 9 eligible, market 7 of 9) would have to reproduce on a corpus well past 27 games before either is read as a property of the forecasts.
6 Limitations
- Every figure here is revision 2. Segmentation excluded 51,635 of 78,986 MLB ticks (65.4 percent) and 4,738 of 9,003 soccer ticks (52.6 percent); 27,076 MLB ticks (34.3 percent) were the identified label mismatches, the rest going with quarantined files and unlabelled segments. Intervals were re-estimated by game-cluster bootstrap, not widened. The moves against revision 1 are population changes, not evidence that the forecaster improved; it was not retrained.
- state_conditioned_calibration.json's calibration_error carries no confidence interval, unlike the bootstrapped gap_ci in calibration_stability.json, so late-inning miss sizes cannot be tested for significance, and the derived late-inning pair inherits that absence.
- model_prob and market_prob bins share a label but are built independently per source, so cells at the same nominal band are drawn from different row sets and a cell-by-cell subtraction is unpaired.
- 668 of 27,351 MLB rows and 882 of 4,265 soccer_intl rows carry no game-state field and are dropped from the state-conditioned view.
- The soccer_intl corpus is small (27 games aggregate; cells as low as n=7), so soccer verdicts are provisional and rest on a single corpus.
- Both artifacts are a single snapshot (2026-09-16) from one regeneration pass, so neither has been checked against a later or independent season, and both inherit whatever the segmentation rule decided.
7 How to read this on the site
The two tables live interactively in the "calibration" inspector (aggregate bins, both sports) and the "state-reliability" inspector (game-phase x band cells, both sources). The "observation-dependence" inspector explains why resampling game_id is the right unit here.
The figure comes from the calibration_stability module; the state-conditioned cells from the state_conditioned_calibration module, which the site marks partial pending a confidence-interval pass. The join-integrity finding page carries the receipt.
Evidence
- calibration_stability.jsonas_of 2026-09-16Source path: /analytics/m/calibration_stability/
Evidence field inventory (19 paths)
- sports.mlb.n_rows
- sports.mlb.n_games
- sports.mlb.sides.model_prob.brier
- sports.mlb.sides.market_prob.brier
- sports.mlb.sides.model_prob.n_eligible_bins
- sports.mlb.sides.model_prob.n_significant_bins
- sports.mlb.sides.market_prob.n_eligible_bins
- sports.mlb.sides.market_prob.n_significant_bins
- sports.mlb.sides.model_prob.bins[]
- sports.mlb.sides.market_prob.bins[]
- sports.soccer_intl.n_rows
- sports.soccer_intl.n_games
- sports.soccer_intl.sides.model_prob.brier
- sports.soccer_intl.sides.market_prob.brier
- sports.soccer_intl.sides.model_prob.n_significant_bins
- sports.soccer_intl.sides.market_prob.n_significant_bins
- n_boot
- ci_pct
- cluster_unit
- state_conditioned_calibration.jsonas_of 2026-09-16Source path: /analytics/m/state_conditioned_calibration/
Evidence field inventory (14 paths)
- sports.mlb.n_records
- sports.mlb.n_files
- sports.mlb.n_skipped_no_state_field
- sports.mlb.model_ece_n_weighted
- sports.mlb.market_ece_n_weighted
- sports.mlb.buckets[time_bucket=late(inn7+)].prob_bucket
- sports.mlb.buckets[time_bucket=late(inn7+)].source
- sports.soccer_intl.n_records
- sports.soccer_intl.n_skipped_no_state_field
- sports.soccer_intl.model_ece_n_weighted
- sports.soccer_intl.market_ece_n_weighted
- ranked_worst_buckets[]
- skipped[].sport
- skipped[].reason