Research paper
How to read a CourtVision paper
The contract behind every printed number, and what a paper is not allowed to claim
Abstract
This paper describes the research-paper section itself and demonstrates the contract every other paper in it follows. A paper is a short method note: it states one question, names the committed artifact and field path behind each number it prints, carries the denominator next to every rate, closes on what the measurement does not establish, and carries a revision callout when the artifacts beneath it are rebuilt. To show the contract working rather than assert it, the paper reads two published artifacts, both of which were rebuilt on 2026-09-16 after a corpus defect was found. Calibration Stability (as_of 2026-09-16) records, for MLB in-play win probabilities, a model Brier of 0.1668 against a market reference Brier of 0.1510, with 3 of 10 eligible reliability bins carrying a calibration-gap 95 percent interval that excludes zero for the model and 0 of 10 for the market reference. State Conditioned Calibration (as_of 2026-09-16) records 27,351 MLB records across 178 files with an n-weighted calibration error of 0.0494 for the model and 0.0397 for the market reference. Those two readings agree on direction and disagree on emphasis, which is the honest result: the model trails its reference on both artifacts, and the size of the shortfall depends on how the rows are grouped. Neither artifact supports a claim about money, and no paper in this section will make one.
1 Question
The site publishes charts, module pages, inspectors and findings. Each of those answers a narrow question well and none of them explains, at length, how a measurement was taken and what it does not cover. A paper is the place for that. It is a short method note, between about 1,500 and 2,500 words, with a fixed shape: question, data, method, results, robustness, limitations, and how to read the result on the rest of the site.
The question this first paper answers is narrow on purpose: what can a reader assume when they open one of these papers? The answer is a contract with four clauses, and the rest of this note demonstrates each one against artifacts that are already committed to the repository, so that the demonstration is checkable rather than decorative.
- Every number comes from a named field in a published artifact, and the field path appears in the evidence box at the foot of the paper.
- Every rate carries its denominator: rows, ticks, games or files, stated next to the rate rather than in a footnote.
- Every artifact carries its as_of date, or the words 'date not published' when the artifact does not record one.
- Every paper says what its evidence does not establish, and an honest null result is a finished paper rather than a failed one.
- When an artifact beneath a paper is withdrawn or rebuilt, the paper carries a revision callout at the top saying what the old numbers were, when they were withdrawn, and whether the change is a population change or a change in what was measured. The callout above this list is a live example.
2 Data and definitions
Two artifacts are read here. The first is calibration_stability.json, which carries as_of 2026-09-16. It holds ten-bin reliability curves for MLB and international soccer, computed for two sides: the model forecast and a market reference, where the market reference is the devigged closing price treated as a forecast like any other. The second is state_conditioned_calibration.json, which now also carries as_of 2026-09-16. In revision 1 that second artifact published no date and every reference to it was labelled 'date not published'; both files were stamped when they were rebuilt, so that label no longer applies to either.
The two artifacts group the same underlying in-play observations differently. Calibration Stability bins by forecast probability alone. State Conditioned Calibration crosses a time bucket with a probability bucket, so a bin such as late innings at a near-even probability becomes its own cell. This matters because the grouping, not the model, decides how much support sits behind each published number.
One definition is worth stating before any figure is read. A tick is one forecast observation inside a game, and a game contributes many ticks. State_conditioned_calibration.json records n_records of 27,351 for MLB across n_files of 178, with n_skipped_no_state_field of 668 records that carried no usable state field and were dropped. Ticks inside one game are not independent observations, which is why the interval method described below resamples games rather than ticks.
Those counts also show why the revision callout exists. In revision 1 the same three fields read 78,986 records across 227 files with 26,340 dropped. The forecaster did not change; the corpus did. A number that moves for that reason is a population change, and a paper has to say so.
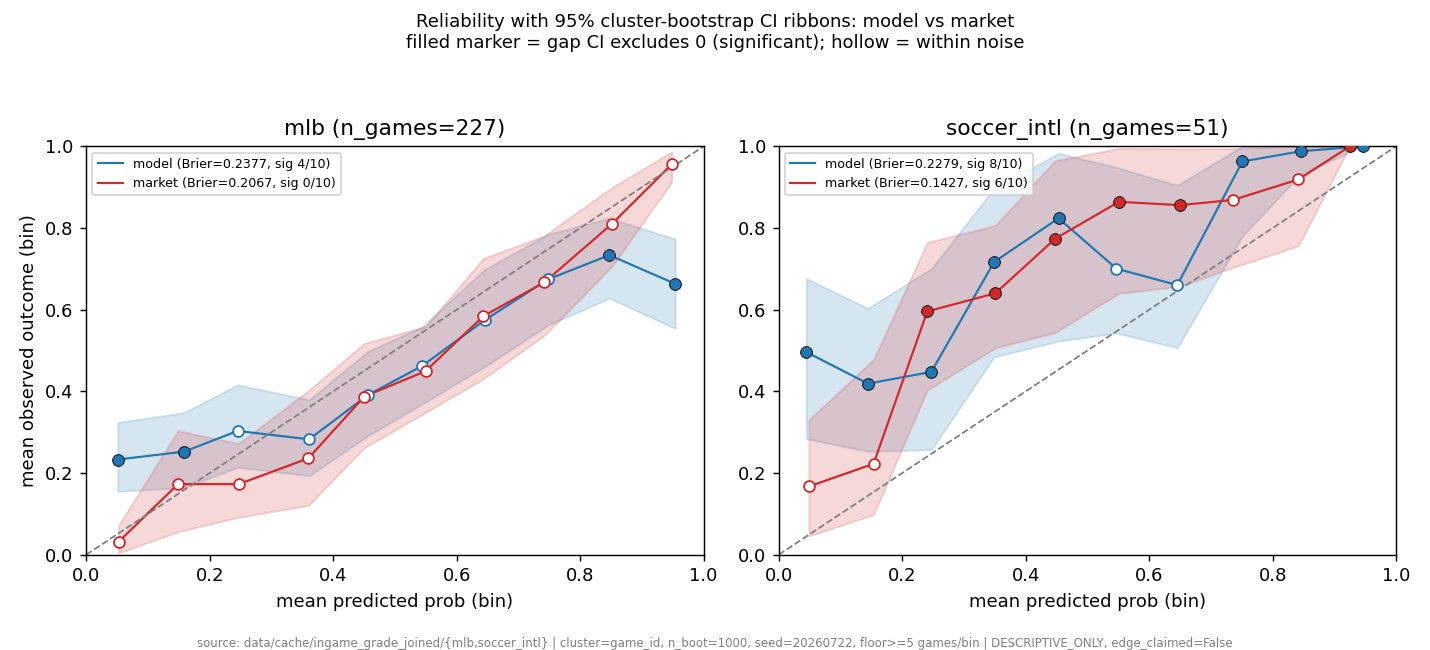
The published Calibration Stability chart. The reliability curves it draws are the same rows this paper reads by field path.
3 Method
Neither artifact was recomputed for this paper. Both were read as published, which is the only thing a paper is allowed to do: quote a field, or form a trivial difference or ratio of two quoted fields and say so in the sentence where it appears. Anything else belongs in a module, where it can be regenerated and checked.
Calibration Stability records its own interval method in the artifact. It uses a cluster bootstrap that resamples game_id with replacement and re-bins, with n_boot of 1000 draws, an interval of 2.5 to 97.5 percent, and a floor of 5 games per eligible bin. A bin is marked significant when its calibration-gap interval excludes zero. The gap itself is the mean observed outcome minus the mean forecast.
gap = mean_y - mean_p ; Brier = mean((p - y)^2)
State Conditioned Calibration reports a single n-weighted calibration error per sport and side, which is the support-weighted mean of the absolute per-cell gaps. It publishes no interval, so every number taken from it in this paper is a point estimate with a denominator and no uncertainty statement attached. That asymmetry between the two artifacts is a real limit on what can be compared, and it is carried through the results rather than smoothed over. It matters more after the rebuild than before it, because the corpus behind every point estimate is now about a third the size.
4 Results
At the whole-curve level, calibration_stability.json records an MLB model Brier of 0.1668 and a market-reference Brier of 0.1510. The difference of those two quoted values is 0.0158 in favour of the reference. For international soccer the same artifact records a model Brier of 0.3325. Lower is better for a Brier score, so on this artifact the model trails its reference in MLB. Both MLB figures fell against revision 1 (0.2377 model, 0.2067 reference) and both soccer figures rose; neither move is a change in the forecaster, and the receipt records that the soccer rise follows from the draw share of scored ticks falling from 0.2615 to 0.1376, which raises the Brier of every side at once.
The bin counts say where the disagreement sits. For MLB, 3 of 10 eligible model bins carry a calibration-gap interval that excludes zero and 7 sit within noise; for the market reference, 0 of 10 bins exclude zero. For international soccer, 8 of 9 eligible model bins exclude zero and 1 sits within noise. A reader who stops at the Brier scores would miss that the MLB model is within noise in most of its bins while the soccer model is not.
| Bin | Ticks (n) | Games | Mean forecast | Observed rate | Gap | Gap 95 pct interval |
|---|---|---|---|---|---|---|
| 0.2 to 0.3 | 1,774 | 69 | 0.2449 | 0.1065 | -0.1384 | -0.2157 to -0.0448 |
| 0.4 to 0.5 | 3,859 | 100 | 0.4581 | 0.3713 | -0.0867 | -0.2195 to 0.0512 |
| 0.5 to 0.6 | 5,636 | 114 | 0.5433 | 0.5520 | +0.0087 | -0.1026 to 0.1217 |
| 0.6 to 0.7 | 4,026 | 95 | 0.6469 | 0.6426 | -0.0043 | -0.1475 to 0.1340 |
Source: calibration_stability.json, sports.mlb.sides.model_prob.bins. The first row excludes zero; the other three do not.
The busiest bin shown is the artifact's near-even range: 5,636 ticks drawn from 114 distinct games, a mean forecast of 0.5433 against an observed rate of 0.5520, a gap of +0.0087, and an interval from -0.1026 to 0.1217 that contains zero. Five thousand ticks look like a large sample until the game count is read next to them, and 114 games is the number that sets the width of that interval.
The 0.2 to 0.3 bin behaves differently. With 1,774 ticks over 69 games, a mean forecast of 0.2449 and an observed rate of 0.1065, its gap of -0.1384 has an interval from -0.2157 to -0.0448, which excludes zero. Forecasts in that bin gave the outcome roughly a one-in-four chance when it landed about one time in nine, and the interval says the pattern survives resampling by game.
Grouping by game state moves the emphasis. State_conditioned_calibration.json, as_of 2026-09-16, records an n-weighted calibration error of 0.0494 for the MLB model against 0.0397 for the market reference. Inside that summary the cells differ widely: the early-innings near-even cell holds 5,754 model records with a calibration error of 0.0215, while the late-innings near-even cell holds 820 model records with a calibration error of 0.0291. The late cell looks slightly worse and rests on roughly a seventh of the support, so the difference between the two is not a finding. Revision 1 read this pair the other way round, with the late cell ahead; that ordering did not survive the rebuild, which is exactly why a paper prints the denominator beside the rate.
5 Robustness and what would falsify this
The claim this paper makes is narrow: two published artifacts, read by field path, agree that the MLB model trails its market reference and disagree about how large the shortfall is once rows are grouped by game state. Three things would falsify it.
- A rerun of calibration_stability.json on a later corpus that records an MLB model Brier at or below the market-reference Brier, with the same cluster-bootstrap settings, would overturn the direction.
- An interval published for state_conditioned_calibration.json that covered zero for the difference between the two n-weighted calibration errors would remove the second artifact from the argument entirely.
- A grouping in which the model's significant-bin count fell to zero while the reference's rose would reverse the bin-count reading, which is currently 3 of 10 against 0 of 10 for MLB.
- The 2026-09-16 rebuild is a worked example of that third clause: individual bins moved enough to change which ones excluded zero, while the direction of the whole-curve reading held.
One robustness property is already visible in the artifact. The cluster bootstrap resamples game_id rather than ticks, so a bin's interval widens when its ticks come from few games. The 0.5 to 0.6 bin, with 5,636 ticks from 114 games, carries an interval roughly 0.22 wide -- re-estimated by that bootstrap on the segment-clean corpus, not widened from a revision-1 figure. Any future reading that treats ticks as independent observations will report intervals that are too narrow, and this paper would rather be falsified by a wider one than supported by a narrower one.
6 Limitations
The evidence here is weaker than the two artifacts might suggest at first reading, in four specific ways.
- The two artifacts are not a paired comparison. They group overlapping observations under different rules and different eligibility floors, so their numbers cannot be differenced against each other.
- Both artifacts were rebuilt from one corpus correction on one day, so a shared as_of of 2026-09-16 records when they were regenerated, not that they were independently confirmed.
- An n-weighted calibration error summarises absolute gaps, which means offsetting errors in opposite directions do not cancel. It is not comparable to a Brier score.
- Both artifacts are descriptive. Nothing in them identifies why a bin is miscalibrated, and a gap that excludes zero on one corpus is not a mechanism.
- The corrected corpus holds 27,351 of the 78,986 MLB ticks revision 1 read, so every interval here was re-estimated on that smaller population and every point estimate rests on fewer games.
7 How to read this on the site
Every paper ends with an evidence box listing its artifacts, their as_of dates and the exact field paths it read, plus a link into each source module page where the artifact and its chart live. The intended order is to read the paper first, open the module page to confirm the field, then open the inspector to work through the rows interactively.
Source moduleState Conditioned CalibrationThe state-conditioned source publishes no chart. Its buckets are readable as a table on its module page and in the state reliability inspector.No chart is published for this source. Open the module page for its table of measurements.Two habits make the section useful. First, read the denominator before the rate: a calibration error of 0.0291 over 820 records is a different object from one over 5,754 records, and the papers always print both. Second, read the limitations section before quoting a paper elsewhere, because that is where each paper records the comparison it is not entitled to make. Third, check the revision callout before quoting a number, because a figure withdrawn in revision 1 may still be circulating elsewhere.
Finally, a note on vocabulary. These papers describe calibration, reliability, resolution and gaps. They use the market as a reference forecast and never as a target to be beaten, and they do not discuss money in any form. A paper that needs that vocabulary to make its point does not belong in this section.
Evidence
- calibration_stability.jsonas_of 2026-09-16Source path: /analytics/m/calibration_stability/
Evidence field inventory (20 paths)
- sports.mlb.sides.model_prob.brier
- sports.mlb.sides.market_prob.brier
- sports.mlb.sides.model_prob.n_eligible_bins
- sports.mlb.sides.model_prob.n_significant_bins
- sports.mlb.sides.model_prob.n_within_noise_bins
- sports.mlb.sides.market_prob.n_significant_bins
- sports.mlb.sides.model_prob.bins[].n
- sports.mlb.sides.model_prob.bins[].n_games
- sports.mlb.sides.model_prob.bins[].mean_p
- sports.mlb.sides.model_prob.bins[].mean_y
- sports.mlb.sides.model_prob.bins[].gap
- sports.mlb.sides.model_prob.bins[].gap_ci
- sports.soccer_intl.sides.model_prob.brier
- sports.soccer_intl.sides.model_prob.n_significant_bins
- sports.soccer_intl.sides.model_prob.n_within_noise_bins
- n_boot
- ci_pct
- cluster_unit
- min_games_per_bin_floor
- method
- state_conditioned_calibration.jsonas_of 2026-09-16Source path: /analytics/m/state_conditioned_calibration/
Evidence field inventory (9 paths)
- sports.mlb.n_files
- sports.mlb.n_records
- sports.mlb.n_skipped_no_state_field
- sports.mlb.model_ece_n_weighted
- sports.mlb.market_ece_n_weighted
- sports.mlb.buckets[].n
- sports.mlb.buckets[].calibration_error
- sports.mlb.buckets[].time_bucket
- sports.mlb.buckets[].prob_bucket