Front-runner vs comeback: honestly not buildable here
What it means
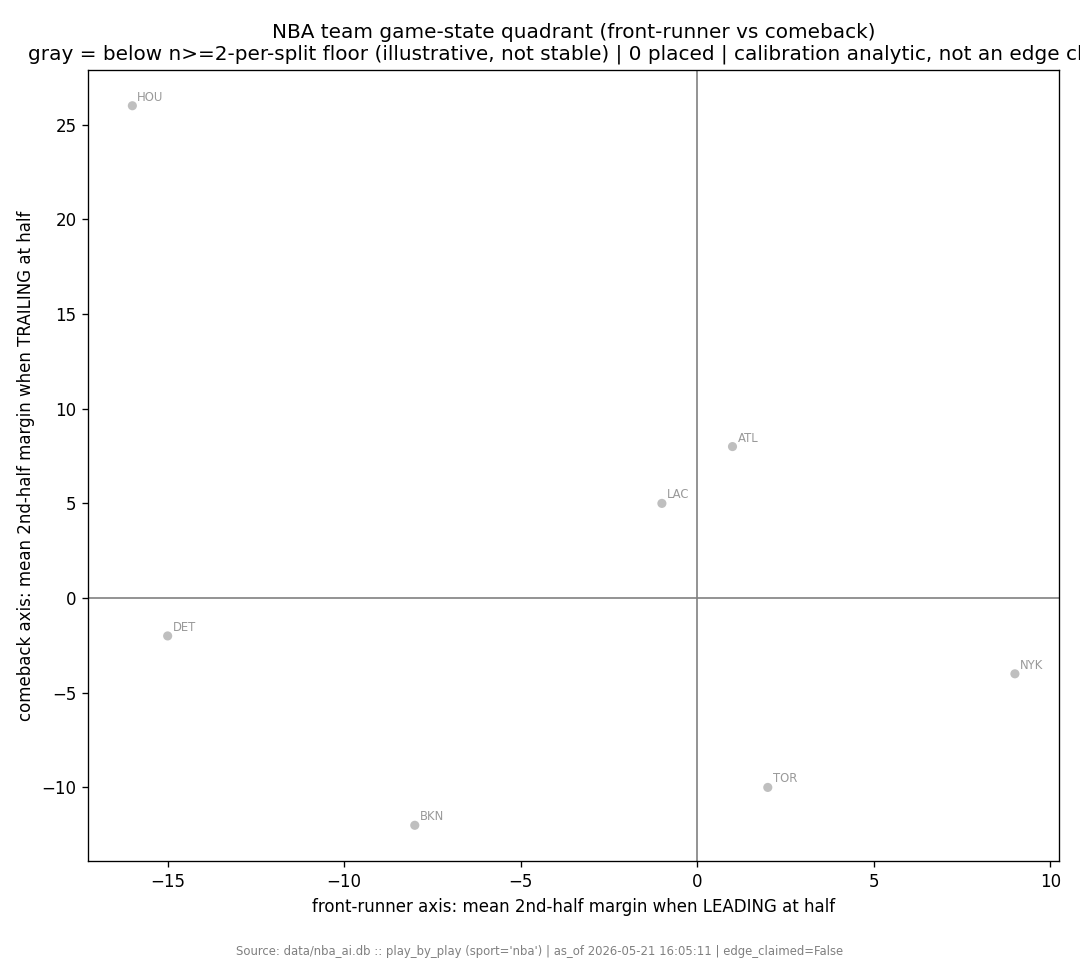
The intended analytic -- which teams protect leads versus storm back -- needs each team to appear in both halftime states enough times, and this thin 26-game slice simply doesn't have the sample, so the module refuses to print per-team labels rather than dress up 1-2 game noise as a tendency. What does survive is the pooled pattern: on average a team that led at half went on to a +1.346 second-half margin, its trailing counterpart -1.346, and the weak positive slope means halftime edges tended to hold or slightly compound in this sample.
Caveats & confounds
Thin corpus: most teams appear 1-2 times, so per-team splits are 0-2 games and are masked, never printed as stable. Descriptive stat, not an edge claim.
Method. halftime margin & second-half margin per team-game from running pbp scores; split each team's games by led/trailed at half