Browse › Nba Matchup Grid
Analytics module · as of
Matchup grid: the fastest and slowest pairings in the league
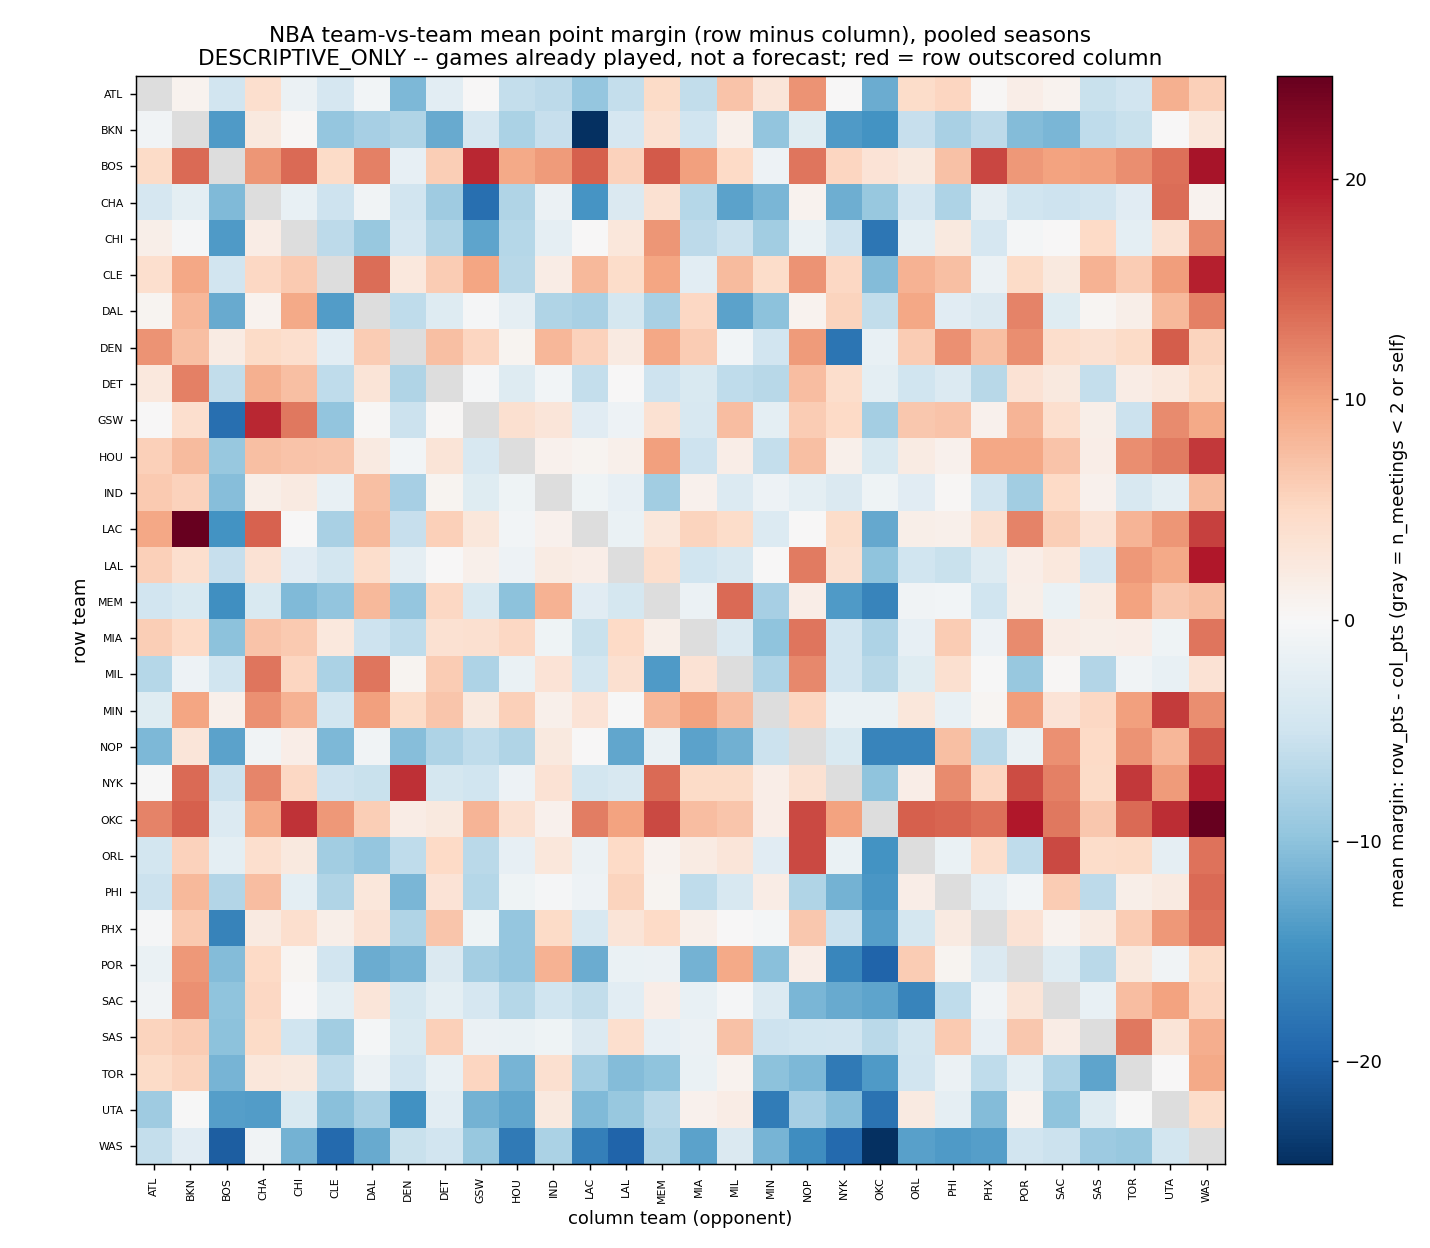
Pooled over three seasons and 870 team pairings, Atlanta versus Indiana is the highest-scoring matchup at a mean of 255.7 combined points over 10 meetings, while Charlotte versus Portland is the lowest at 197.0 -- a 58-point gap between the league's fastest and slowest recurring games.
confirmednull (a finding)not testabledescriptivepending
Nba Matchup Grid
What it means
Every game is reduced to two team-point totals and pooled by pairing to describe how much scoring each recurring matchup has actually produced. The spread is large: an ATL-IND game has averaged nearly 60 more combined points than a CHA-POR game, a real stylistic signature of who plays fast and loose versus slow and grinding. This describes games already played -- it is not a forecast of any future meeting.
Caveats & confounds
DESCRIPTIVE_ONLY: NOT a prediction of any future matchup, NOT a home/away split (the per-player table carries no venue flag), and pooled across the 2023-24 to 2025-26 seasons.
Ask Scout about this