Research paper
Form curves and consistency: what rolling NBA production shows, and what it does not forecast
Reading 10-game rolling composites, shrunk consistency profiles and a pairwise scoring grid as description, not prediction
Abstract
This paper reads three published measurements of NBA box-score production, pooled over the 2023-24 through 2025-26 seasons, and asks what each one does and does not establish. The form metric is a 10-game minute-weighted per-36 composite over a frozen box-score weighting; nba_form_curves.json retains a qualifying window for 619 of 807 unique players across 77,744 player-game rows, pools 61,298 windows, and reports a league median of 13.754 (10th percentile 8.95, 90th percentile 20.113). The largest recorded riser, Victor Wembanyama, moved from a first-window composite of 18.048 to a last-window composite of 37.869 (delta +19.821, 179 qualifying games); the largest recorded faller, Myles Turner, moved from 20.431 to 9.387 (delta -11.043, 214 qualifying games). Consistency is a shrunk coefficient of variation across per-36 points, rebounds and assists; 579 of 807 players meet its qualifying floor, and the published composite CV ranges from 0.3448 (Luka Doncic, 184 games) to 0.8849 (P.J. Tucker, 26 games). The matchup grid pools 3,611 two-team games into 870 unique pairings, none masked out under a 2-meeting floor; ATL-IND runs highest at a 255.7-point mean total across 10 meetings, and CHA-POR lowest at 197.0 across 6 meetings. None of the three measures forecasts anything: an endpoint is whichever window happened to be retained last, windows overlap rather than standing as independent samples, and the largest movers mostly start from an already-extreme value that regresses toward the median by construction.
1 Question
Rolling production curves and per-player consistency profiles are two of the most common descriptive lenses reached for during an NBA season, and a pairwise matchup grid is the most common way historical head-to-head scoring gets summarized. This paper asks three narrow questions about three published measurements built from the same box-score corpus: what does a form-curve endpoint actually describe, what does a consistency composite actually describe, and what does a matchup-grid cell actually describe. None of the three was fit to a target and scored out of sample, so none of them is treated here as a forecast; the question is only whether the published numbers are being read correctly.
2 Data and definitions
Three published artifacts back this paper: nba_form_curves.json (10-game rolling per-36 production composites), nba_consistency_profiles.json (per-player game-to-game dispersion), and nba_matchup_grid.json (pairwise team scoring history). All three are built from data/domains/basketball_nba/player_boxscores.parquet, the NBA box-score table cited in docs/JOB_EVIDENCE_PACKET.md, and all three pool the 2023-24, 2024-25 and 2025-26 seasons. This is NBA season box-score data, not the in-game tick corpus that the MLB in-game quarantine notice covers, so that quarantine does not apply to anything measured in this paper.
The shared input is 77,744 player-game rows across 807 unique players. Of those players, 619 retain at least one qualifying 10-game form window and 562 qualify as eligible movers with both a first and a last retained window; a separate, stricter floor (at least 15 qualifying games and at least 10 minutes per game) leaves 579 players in the consistency profile. The matchup grid pools 3,611 total games, all of them two-team games (games_dropped_not_two_team is 0), into 870 unique row/column team pairings, and its own 2-meeting floor masks out zero of those 870 pairings.
3 Method
The form metric is a 10-game minute-weighted rolling composite built on a frozen per-36 box-score weighting (points and rebounds and steals at 1.0, blocks and assists at 0.7, field-goal attempts at -0.7, free-throw attempts at -0.4, turnovers at -1.0, personal fouls at -0.4) -- the same Win-Score-style convention used elsewhere in the box-value-index work, with weights frozen and not tuned to any output. A player qualifies for a window only at 8 or more minutes that game, a window total of 120 or more minutes, and 20 or more qualifying games across the pooled span.
form_per36 = sum(weighted per-game stats in the 10-game window) / (sum(window minutes) / 36)
The published mover_delta is the last retained window's composite minus the first retained window's composite over each player's observed span. Windows can abut but are not claimed to be disjoint, and the artifact's own methodology labels this a trajectory over whatever games were retained, not a forecast of what comes next.
The consistency measure is the coefficient of variation (sample standard deviation over mean, with the ddof=1 correction) of a player's per-36 points, rebounds and assists across qualifying games, each shrunk toward the league mean CV to stabilize low-game-count players.
cv_shrunk = w * cv_raw + (1 - w) * league_mean_cv, w = games / (games + 20)
The shrink constant is fixed at 20 games and is not tuned to the output. The league mean raw CVs it shrinks toward are 0.5242 for points, 0.5561 for rebounds and 0.7825 for assists, and the published composite is an unweighted mean of the three shrunk per-stat CVs. A lower composite means steadier game-to-game per-36 output. The artifact's own caveat is that CV inflates mechanically for a low-mean stat, so a rebound or assist CV sits on a different scale than a points CV across different player roles, and consistency in this sense is not the same thing as skill or offensive value.
The matchup grid's unit is a team-game point total. For every game with exactly two distinct teams, mean_total is the mean of (row-team points plus column-team points) across that pairing's meetings, symmetric by construction, and mean_margin is the mean of (row-team points minus column-team points), which pools home and away meetings together rather than splitting by venue. A pairing is reported only where it has 2 or more recorded meetings.
4 Results
Table 1 lists six of the published form-curve endpoints, spanning both the largest gains and the largest declines in the top-movers lists. Every row below is drawn directly from nba_form_curves.json's top_movers_risers and top_movers_fallers arrays.
| Player | Window | First composite | Last composite | Delta | Qualifying games (n) | Span |
|---|---|---|---|---|---|---|
| Victor Wembanyama | 10-game | 18.048 | 37.869 | +19.821 | 179 | 2023-11-12 to 2026-04-10 |
| Myles Turner | 10-game | 20.431 | 9.387 | -11.043 | 214 | 2023-11-12 to 2026-04-03 |
| Donovan Clingan | 10-game | 16.391 | 29.942 | +13.551 | 135 | 2024-11-08 to 2026-04-08 |
| Isaiah Hartenstein | 10-game | 15.465 | 25.966 | +10.501 | 178 | 2023-11-13 to 2026-04-08 |
| Khris Middleton | 10-game | 17.422 | 8.695 | -8.727 | 149 | 2023-11-17 to 2026-04-10 |
| Scoot Henderson | 10-game | 3.543 | 12.558 | +9.015 | 150 | 2023-12-02 to 2026-04-08 |
Source: nba_form_curves.json, top_movers_risers and top_movers_fallers.
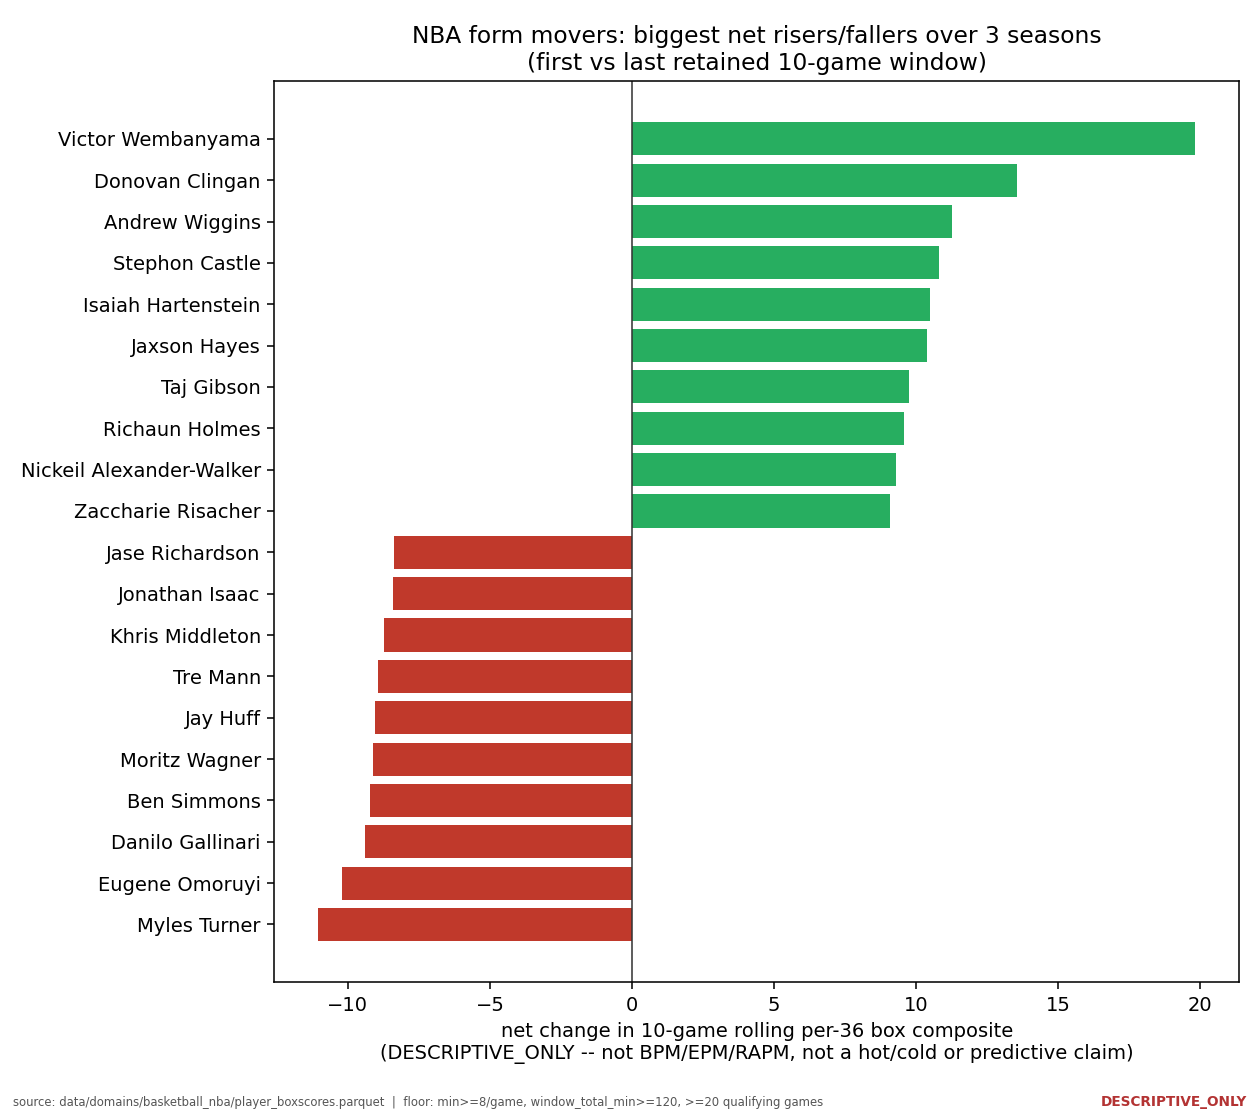
Published 10-game rolling per-36 form composites: league percentile bands and the largest recorded risers and fallers.
The league's own percentile bands put those endpoints in context: the pooled 10-game composite runs from a 10th percentile of 8.95 to a 90th percentile of 20.113, with a median of 13.754. Wembanyama's last-window composite of 37.869 sits at the 100.0 last-window league percentile the artifact reports for him; Turner's last-window composite of 9.387 sits at a 12.6 last-window percentile, down from a first-window composite of 20.431 that was already above the 90th-percentile band.
| Player | Composite CV (shrunk) | Points CV | Rebounds CV | Assists CV | Games (n) | Shrink weight |
|---|---|---|---|---|---|---|
| Luka Doncic | 0.3448 | 0.2799 | 0.3569 | 0.3975 | 184 | 0.902 |
| Nikola Jokic | 0.3456 | 0.3103 | 0.3194 | 0.4072 | 210 | 0.913 |
| Domantas Sabonis | 0.3712 | 0.3297 | 0.3129 | 0.4710 | 170 | 0.895 |
| Gary Harris | 0.8818 | 0.8043 | 0.7901 | 1.0511 | 125 | 0.862 |
| Cam Reddish | 0.8839 | 0.7481 | 0.7678 | 1.1359 | 71 | 0.780 |
| P.J. Tucker | 0.8849 | 0.8862 | 0.5287 | 1.2398 | 26 | 0.565 |
Source: nba_consistency_profiles.json (as_of 2026-04-12), most_consistent_top15 and least_consistent_top15.
The consistency distribution's own summary states the same kind of range: composite CV runs from a minimum of 0.3448 to a maximum of 0.8849 across the 579 qualifying players, with a median of 0.6235 and a mean of 0.6128; the six players in Table 2 sit at the two ends of that 579-player distribution. Gary Harris also appears in Table 1's fallers list (delta -6.793, 131 qualifying games there) under the form curve's own floor, a different qualifying-game count than his 125 in the consistency profile because the two artifacts apply different game floors to the same underlying player -- a reminder that these are two separate gates over the same box scores, not one shared sample.
| Pairing | Meetings (n) | Mean combined points | Mean row-team margin |
|---|---|---|---|
| ATL vs IND | 10 | 255.7 | -6.5 |
| CHA vs POR | 6 | 197.0 | -5.0 |
| ATL vs BOS | 11 | 228.18 | -4.73 |
| BOS vs LAL | 6 | 219.33 | 5.67 |
| DEN vs GSW | 11 | 232.36 | 5.27 |
| HOU vs DAL | 12 | 226.08 | 2.25 |
Source: nba_matchup_grid.json, extremes_descriptive and pairings; ATL-IND and CHA-POR are the published highest- and lowest-scoring pairings.
ATL-IND and CHA-POR are the two extremes the artifact names directly, 58.7 points apart in mean combined score (255.7 minus 197.0, a direct difference of the two published means, over 10 and 6 meetings respectively); the other four pairings in Table 3 fall inside that range.
5 Robustness and what would falsify this
- Endpoint sensitivity: last_form is whichever 10-game window happened to be retained last for that player, so an injury, a role change or a short slump inside that specific window moves the reported endpoint by construction; nothing in the published fields distinguishes a durable level shift from a window that happened to land on a hot or cold stretch.
- Window choice matters: the 10-game window is a fixed methodology choice (window_games = 10), not a value selected because it produced the largest or cleanest movers; a shorter or longer window would relabel the same underlying games into different composites and could reorder the published top-movers lists.
- Overlapping windows are not independent observations: pooled_windows is 61,298 drawn from only 619 players with a retained window, so most of a single player's contribution to the pooled percentile bands comes from windows that share games with each other, and mover_delta compares two such overlapping-window endpoints rather than two independent samples.
- Regression to the mean shows up directly in the mover lists: the largest fallers mostly start from an unusually high first-window composite (Turner's first_form of 20.431 is already above the 90th-percentile band of 20.113), and the largest risers mostly start unusually low (Henderson's first_form of 3.543 is below the 8.95 10th-percentile band), which is the pattern an extreme-selected sample produces even without any real change in a player's underlying level.
- The consistency shrinkage formula exists for the same reason: a player with few qualifying games (P.J. Tucker's shrink weight of 0.565 on 26 games) has an unstable raw CV that the formula deliberately pulls toward the league mean CV rather than reporting it at face value; that is a stated bias-variance choice, not a claim that the shrunk number removes all uncertainty.
- The verdict is cheap to falsify in either direction: a wider corpus or a different window/floor choice that reproduced the same top and bottom names, in the same rank order, would strengthen the descriptive read; a corpus where the ranking flipped under a small window change would show just how much of the ranking is endpoint noise rather than a stable property of the player.
6 Limitations
- Form-curve deltas are not a live hot/cold signal: mover_delta is a net change over each player's whole observed span, and the underlying composite is a box-only Win-Score-style measure, not BPM, EPM, RAPM or DARKO.
- The form composite is not age-, opponent- or role-adjusted; it is a raw per-36 box rate, and it is not player-id-deduplicated (the artifact's own not_this list notes that accented names can be split across ids upstream and that split carries through unchanged).
- Consistency (coefficient of variation) is not a skill or value metric: a low-volume role player can register a very low CV at low output, and the composite is not opponent-, rest-, role- or home/away-adjusted.
- The matchup grid's mean_margin pools home and away meetings into one anti-symmetric number; it is not a home-court split, and neither mean_total nor mean_margin is opponent-adjusted or strength-of-schedule-adjusted.
- All three artifacts pool the same three seasons (2023-24 through 2025-26) of one NBA box-score table; nothing in this paper is drawn from an independent second corpus or a held-out season.
7 How to read this on the site
The module pages for nba_form_curves, nba_consistency_profiles and nba_matchup_grid each publish the full top-15/bottom-15 or pairing lists behind the excerpts in Tables 1 through 3; read the methodology block on each page before reading its numbers, since the qualifying floor and the pooling window differ across the three artifacts. The related analyses on the site apply the same published fields through an endpoint-relative-to-start lens, a per-stat variability-range lens, and a pooled-versus-pairing-mean lens; each is a different arithmetic view of the numbers cited here, not a new measurement.
Evidence
- nba_form_curves.jsondate not publishedSource path: /analytics/m/nba_form_curves/
Evidence field inventory (30 paths)
- methodology.form_metric
- methodology.window_games
- methodology.floors
- methodology.mover_delta
- methodology.seasons_pooled
- input_coverage.rows
- input_coverage.unique_players
- input_coverage.players_with_retained_window
- input_coverage.movers_eligible
- input_coverage.pooled_windows
- league_percentile_bands.p10
- league_percentile_bands.p50
- league_percentile_bands.p90
- not_this
- top_movers_risers[].player_name
- top_movers_risers[].delta
- top_movers_risers[].first_form
- top_movers_risers[].last_form
- top_movers_risers[].n_qual_games
- top_movers_risers[].first_date
- top_movers_risers[].last_date
- top_movers_risers[].last_form_league_pctile
- top_movers_fallers[].player_name
- top_movers_fallers[].delta
- top_movers_fallers[].first_form
- top_movers_fallers[].last_form
- top_movers_fallers[].n_qual_games
- top_movers_fallers[].first_date
- top_movers_fallers[].last_date
- top_movers_fallers[].last_form_league_pctile
- nba_consistency_profiles.jsonas_of 2026-04-12Source path: /analytics/m/nba_consistency_profiles/
Evidence field inventory (33 paths)
- methodology.measure
- methodology.per36
- methodology.shrinkage
- methodology.shrink_k_games
- methodology.min_qualifying_games_floor
- methodology.min_game_minutes_floor
- methodology.league_mean_cv_raw
- methodology.composite
- methodology.caveat
- methodology.seasons_pooled
- not_this
- input_coverage.rows
- input_coverage.unique_players
- input_coverage.players_meeting_floor
- composite_cv_distribution.n
- composite_cv_distribution.min
- composite_cv_distribution.median
- composite_cv_distribution.max
- composite_cv_distribution.mean
- most_consistent_top15[].player_name
- most_consistent_top15[].composite_cv_shrunk
- most_consistent_top15[].games
- most_consistent_top15[].shrink_weight
- most_consistent_top15[].pts_cv_shrunk
- most_consistent_top15[].reb_cv_shrunk
- most_consistent_top15[].ast_cv_shrunk
- least_consistent_top15[].player_name
- least_consistent_top15[].composite_cv_shrunk
- least_consistent_top15[].games
- least_consistent_top15[].shrink_weight
- least_consistent_top15[].pts_cv_shrunk
- least_consistent_top15[].reb_cv_shrunk
- least_consistent_top15[].ast_cv_shrunk
- nba_matchup_grid.jsondate not publishedSource path: /analytics/m/nba_matchup_grid/
Evidence field inventory (37 paths)
- methodology.unit
- methodology.game_filter
- methodology.mean_total
- methodology.mean_margin
- methodology.not_this
- mask.min_meetings
- mask.pairings_before_mask
- mask.pairings_kept
- mask.pairings_masked_out
- input_coverage.rows
- input_coverage.games_total
- input_coverage.games_two_team
- input_coverage.games_dropped_not_two_team
- input_coverage.seasons
- input_coverage.date_max
- extremes_descriptive.highest_scoring_pairing.row
- extremes_descriptive.highest_scoring_pairing.col
- extremes_descriptive.highest_scoring_pairing.n_meetings
- extremes_descriptive.highest_scoring_pairing.mean_total
- extremes_descriptive.highest_scoring_pairing.mean_margin
- extremes_descriptive.lowest_scoring_pairing.row
- extremes_descriptive.lowest_scoring_pairing.col
- extremes_descriptive.lowest_scoring_pairing.n_meetings
- extremes_descriptive.lowest_scoring_pairing.mean_total
- extremes_descriptive.lowest_scoring_pairing.mean_margin
- pairings[row=ATL,col=BOS].n_meetings
- pairings[row=ATL,col=BOS].mean_total
- pairings[row=ATL,col=BOS].mean_margin
- pairings[row=BOS,col=LAL].n_meetings
- pairings[row=BOS,col=LAL].mean_total
- pairings[row=BOS,col=LAL].mean_margin
- pairings[row=DEN,col=GSW].n_meetings
- pairings[row=DEN,col=GSW].mean_total
- pairings[row=DEN,col=GSW].mean_margin
- pairings[row=HOU,col=DAL].n_meetings
- pairings[row=HOU,col=DAL].mean_total
- pairings[row=HOU,col=DAL].mean_margin