The league's biggest form movers, up and down
Descriptive only
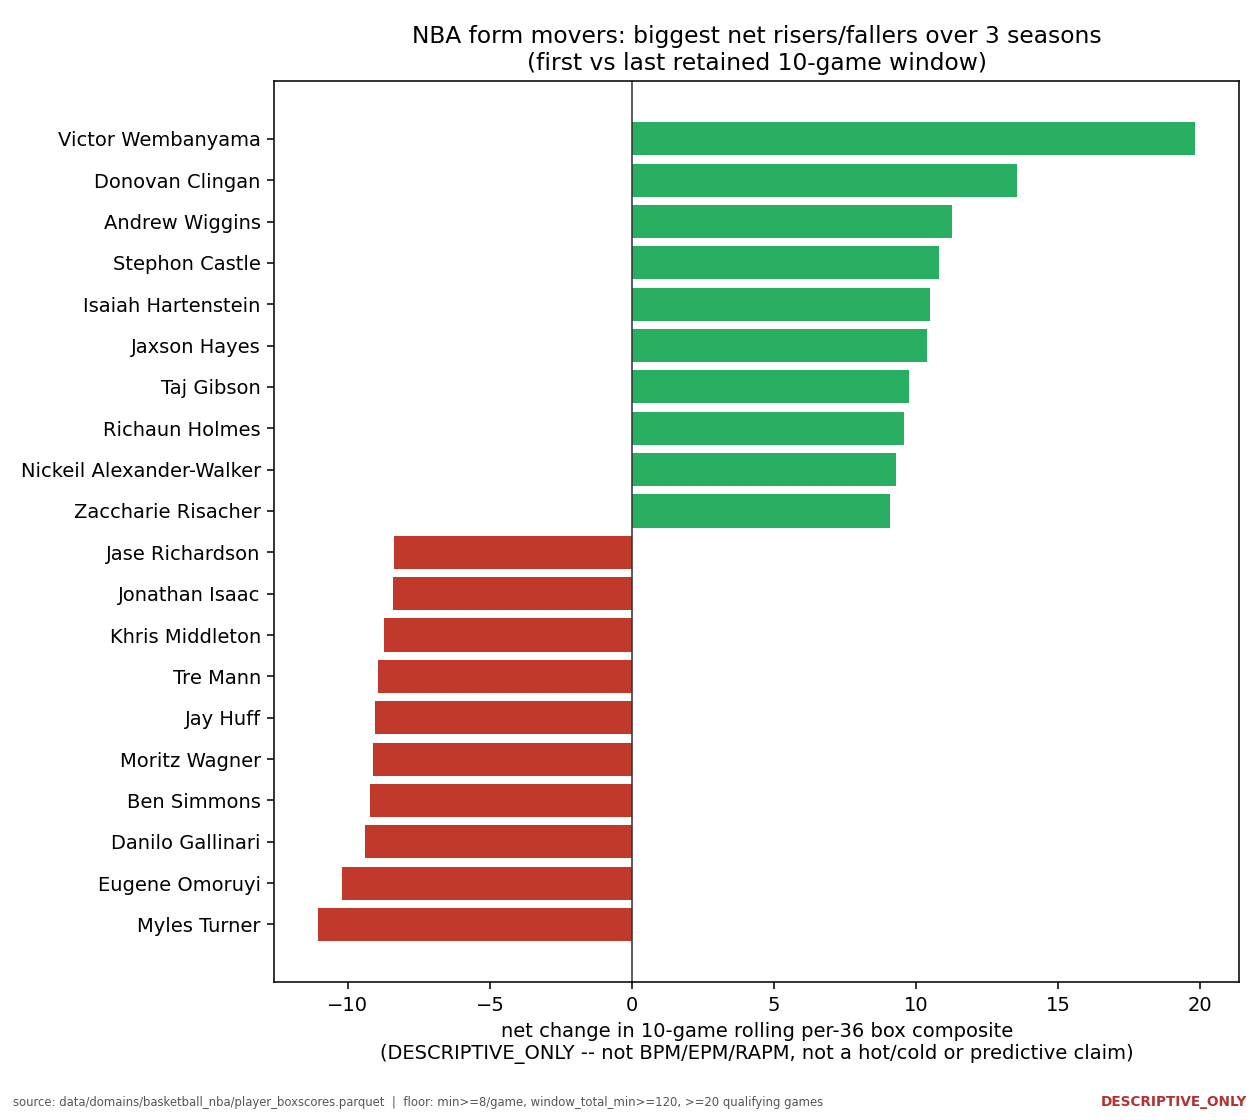
How to read this figure
Each mover shows first_form and last_form (window box-composite values) and the delta between them; last_form_league_pctile places the ending level against the whole league.
Continue with the data
Open the interactive analysis: How large is endpoint form movement?What it means
This tracks each player's trajectory as a 10-game minute-weighted per-36 box composite, then measures the net change from first retained window to last. Wembanyama's box production roughly doubled from 18.048 to 37.869; the league median band sits at 13.754, which is how far above the middle his finish is. The mirror image is Myles Turner, the biggest faller at -11.043.
Caveats and confounds
Descriptive only -- box-composite only (NOT BPM/EPM/RAPM/DARKO), NOT age/opponent/role adjusted, and NOT player_id-deduped (accented names can split across ids). Delta is a net change over the whole span, not a current streak.