Within-game errors barely change tick to tick
mlb: median within-game lag-1 residual autocorr = model 0.971 (n=173 games), market 0.965 (n=173); share>=0.9 model 0.90 vs market 0.86. soccer_intl: median within-game lag-1 residual autocorr = model 0.966 (n=26 games), market 0.952 (n=...
Data integrity
These MLB/soccer numbers are revision 2, computed on the segment-clean corpus (2026-09-16). Revision 1 values are withdrawn and kept in the regeneration receipt. Segmentation excluded 51,635 of the 78,986 MLB ticks (65.4 percent); the specifically identified label mismatches were a smaller 27,076 (34.3 percent).
- residual_autocorrelation
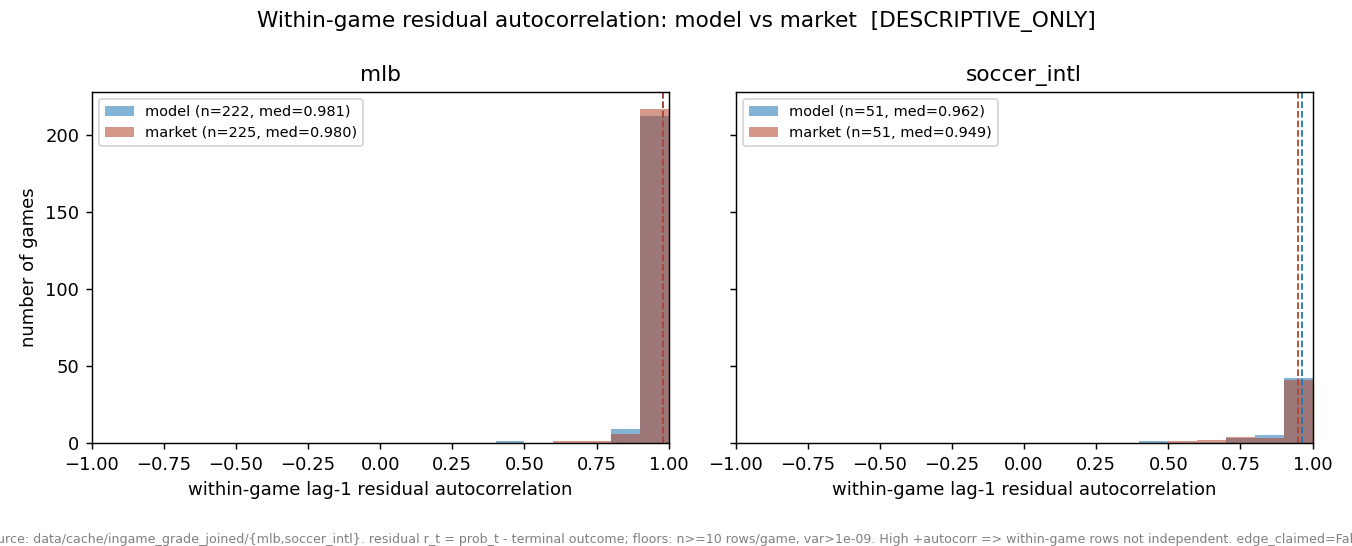
How to read this figure
Each game contributes one lag-1 autocorrelation of its within-game signed residual series; values near 1.0 mean rows move together, so the effective sample size is much smaller than the raw row count.
Published coverage
The committed artifact is partial; only its published coverage is shown here.
| Population | Status | Games | Usable buckets | Published reason |
|---|---|---|---|---|
| MLB | unknown | - | - | - |
| SOCCER_INTL | unknown | - | - | - |
Continue with the data
Open the interactive inspector: Observation dependenceWhat it means
Because the outcome is fixed and the probability path is smooth, consecutive in-game rows are nearly identical, so the 27,351 in-game MLB rows carry far fewer than 27,351 independent observations. This is a guardrail about how to count evidence, not a claim about any team -- the same near-1.0 autocorrelation holds for the market path too (median 0.9645).
Caveats and confounds
descriptive_only; share of games with autocorrelation >= 0.9 is 0.896 for the model and 0.8613 for the market. Games with too few rows or flat residuals are skipped.