Research paper
How many games actually sit behind a bin
Within-game autocorrelation, effective sample size, and the game-cluster bootstrap for MLB and international-soccer calibration
Abstract
Two published calibration exhibits report reliability bins built from thousands of in-game probability rows, but a row is not a game. Within a match the probability paths move in small steps from one tick to the next, so consecutive rows sit close to their neighbor rather than arriving as fresh independent draws. This paper reads three already-published artifacts -- the lag-1 within-game residual-autocorrelation ledger, the effective-sample-size (ESS) ledger it feeds, and the game-cluster bootstrap behind the calibration-stability exhibit -- to state how much independent support a bin row count carries. On the segment-clean corpus MLB contributes 27,351 rows from 178 tick files with a median model-side lag-1 autocorrelation of 0.9713 over the 173 series usable on that side, and international soccer 4,265 rows across 27 files with a median of 0.9662 over 26 usable series. The ESS ledger was not rebuilt with them, so it still describes the joined corpus: 78,986 MLB rows against an AR(1) effective sample size of 761 and a distinct-game anchor of 227, reported as an estimated 18.7-fold interval-width increase under the game-count heuristic, and 9,003 soccer rows against an AR(1) figure of 172, a game anchor of 51 and an estimated 13.3-fold increase. The reading is descriptive only and survives the corpus correction intact: n in a bin caption counts rows, not evidence, and the game count is the number that should anchor how much a reader trusts it.
1 Question
A calibration bin on the published reliability page lists an n, sometimes in the thousands. What is that n made of: how many separate games contributed those rows, whether rows inside one game move independently, and what the effective sample size behind a bin is once that dependence is counted. It also asks why the calibration-stability exhibit already resamples by game rather than by row.
This is a read of three already-published artifacts, not a new measurement: residual_autocorrelation.json, the effective-sample-size ledger it feeds (ess_ledger.json), and the game-cluster bootstrap under calibration_stability.json. No new number is computed beyond simple ratios each artifact already reports. The 2026-09-16 correction rebuilt the first and third and left the second alone, which makes the question of which corpus a figure describes part of the answer.
2 Data and definitions
residual_autocorrelation.json records the lag-1 sample autocorrelation of the signed residual (probability minus terminal outcome) for every (game_id, side) series, ordered by timestamp, for both sports and both sides. Two floors apply before a series counts: at least 10 rows per game, and a minimum residual variance of 1e-9. On the segment-clean corpus MLB contributes 178 files and 178 series across 27,351 rows, and the usable counts now match across sides: 173 series survive the floors on the model side (4 skipped as low_n, 1 as flat) and 173 on the market side. International soccer contributes 27 files and 27 series across 4,265 rows, with 26 usable per side. A third corpus, mlb_clean, is skipped as a byte-identical duplicate.
Revision 1 read 227 files, 227 series and 78,986 rows for MLB, with 222 usable model series and 225 usable market series. Those are withdrawn. The structural change matters more than the size: on the joined corpus the two sides disagreed about how many series were usable, because a mixed tick path could clear the floors on one side and not the other; on the 178 segment-clean MLB series the two sides now skip the same 5.
ess_ledger.json turns that autocorrelation into an effective-sample-size estimate: an AR(1) approximation (ESS_AR1) and a distinct-game anchor, reporting the minimum of the two as ess_anchor because AR(1) is only a first-order model of a path that is smooth and terminal-constant. ess_ledger.json was not regenerated in the 2026-09-16 pass: it carries generated_at 2026-07-25 and still reads 78,986 MLB rows across 227 games and 9,003 soccer rows across 51, with rho_model 0.9809 against the 0.9713 median the rebuilt ledger now reports.
calibration_stability.json is the reliability exhibit itself: 10 probability bins per sport per side, each carrying n (rows) and n_games (distinct games) with a mean forecast, a mean outcome and a calibration gap. The interval around that gap comes from a cluster bootstrap that resamples game_id with replacement 1,000 times, re-bins, and reports the 2.5th and 97.5th percentile. A bin is only reported once its games clear a floor of 5. It was rebuilt on the segment-clean corpus and is dated 2026-09-16.
Why rows inside one game are not independent: the probability path moves in small steps. A tick is a small revision of the tick before it, so consecutive rows are near-duplicates rather than fresh draws, and that smoothness is what the lag-1 coefficient measures. Subtracting the terminal outcome to form the residual shifts every row in a series by the same constant and does not by itself create or change that serial dependence. A bin that catches a game during a long stretch near 55 percent collects many rows saying the same thing about one game, not many independent votes.
3 Method
ESS_AR1 = n_rows * (1 - rho) / (1 + rho)
CI inflation = sqrt(n_rows / ESS)
rho is the per-series lag-1 autocorrelation, summarized per sport as a median across games. ess_ledger.json applies the AR(1) formula, then separately anchors on the distinct-game count, and reports whichever is smaller. Its second formula, sqrt(n_rows / ESS), is an interval-width factor: it estimates how much wider a confidence interval built on the effective sample size is than one built on the raw row count. It is not a statement that the row count is too large by that factor. The game count is the conservative anchor because it needs no model of the dependence structure, only the fact that no two games are the same draw.
The calibration-stability bootstrap works at the game level: each of the 1,000 replicates draws game_ids with replacement, pulls every row belonging to each drawn game, rebuilds the curve, and records the resulting gap per bin. The reported gap_ci is the 2.5/97.5 percentile band under seed 20260722. Because it resamples games, the drop from 227 to 178 MLB games matters more to these intervals than the much larger drop in rows.
4 Results
| Sport | Rows (n_records) | Files and series | Usable series (model) | Median lag-1 autocorr (model) | Share of series at or above 0.9 |
|---|---|---|---|---|---|
| MLB | 27,351 | 178 | 173 | 0.9713 | 0.896 |
| Soccer (international) | 4,265 | 27 | 26 | 0.9662 | 0.8462 |
residual_autocorrelation.json sports.{mlb,soccer_intl}.{n_records,n_files,n_series} and .model.{n_games,median,share_ge_0_9}, as of 2026-09-16.
| Sport | Rows (n_rows) | Games (n_games) | rho_model | ESS, AR1 approx | ESS, game anchor | Interval-width factor at the game anchor |
|---|---|---|---|---|---|---|
| MLB | 78,986 | 227 | 0.9809 | 761 | 227 | 18.7-fold wider |
| Soccer (international) | 9,003 | 51 | 0.9624 | 172 | 51 | 13.3-fold wider |
ess_ledger.json corpora[].{n_rows,n_games,rho_model,ess_ar1,ess_anchor,infl_anchor}, generated_at 2026-07-25. The interval-width factor is infl_anchor, defined by the ledger as sqrt(n_rows / ESS). These rows describe the joined corpus and have not been recomputed on the segment-clean one.
On the ledger's own corpus both sports land on the game count as the tighter anchor: AR(1) alone would say MLB rows carry about 761 independent equivalents (an estimated 10.2-fold interval-width increase, per infl_ar1) and soccer rows about 172, but the distinct-game floor is smaller still -- 227 and 51 -- so it is what the ledger anchors on, reported as an estimated 18.7-fold interval-width increase under the game-count heuristic for MLB and an estimated 13.3-fold interval-width increase for soccer.
Those factors cannot be carried onto the segment-clean corpus, and this paper does not recompute them. What can be said is which way the inputs moved. Row counts fell much faster than game counts -- MLB from 78,986 rows across 227 games to 27,351 across 178 -- so rows per game fell from about 348 to about 154, and the median model-side autocorrelation fell from 0.9809 to 0.9713. Both point the same way: a shorter, cleaner series holds fewer near-duplicate rows. The direction is clear; the magnitude is not published, and no substitute is offered.
share_ge_0_9, the share of usable series with autocorrelation at least 0.9, is 0.896 for MLB model-side and 0.8462 for soccer model-side, so the great majority of games still sit in the high-dependence regime rather than a few outliers driving the median. Market-side rows match: MLB 0.9645 median over the same 173 series (share_ge_0_9 0.8613), soccer 0.9517 over 26 (0.7692). The central claim of this paper is unchanged by the correction, which is the most useful thing the regeneration establishes about it.
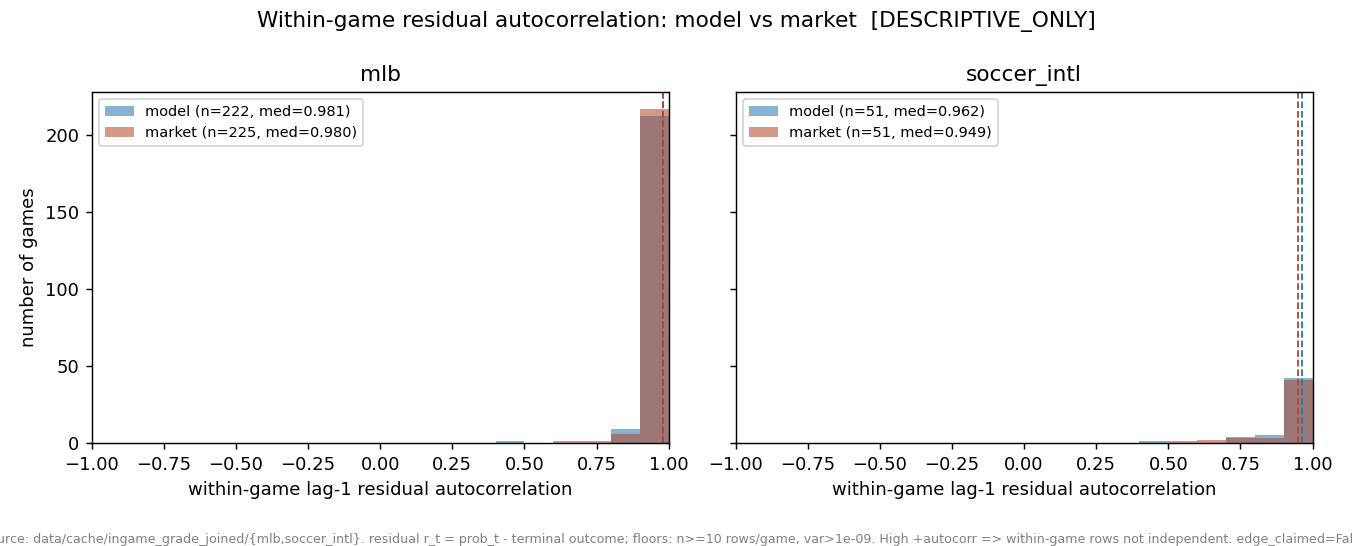
Published lag-1 within-game residual-autocorrelation distribution, MLB and international soccer, model and market sides (residual_autocorrelation.json, as of 2026-09-16).
| Bin | Rows, n | Games, n_games | Rows per game | Calibration gap | 95% gap CI excludes zero |
|---|---|---|---|---|---|
| 0.0-0.1 | 2,072 | 86 | 24.1 | 0.0119 | no |
| 0.1-0.2 | 1,900 | 73 | 26.0 | -0.1099 | yes |
| 0.2-0.3 | 1,774 | 69 | 25.7 | -0.1384 | yes |
| 0.3-0.4 | 2,217 | 80 | 27.7 | -0.1232 | no |
| 0.4-0.5 | 3,859 | 100 | 38.6 | -0.0867 | no |
| 0.5-0.6 | 5,636 | 114 | 49.4 | 0.0087 | no |
| 0.6-0.7 | 4,026 | 95 | 42.4 | -0.0043 | no |
| 0.7-0.8 | 2,024 | 70 | 28.9 | 0.0752 | no |
| 0.8-0.9 | 2,406 | 81 | 29.7 | 0.0927 | yes |
| 0.9-1.0 | 1,437 | 61 | 23.6 | 0.0282 | no |
calibration_stability.json sports.mlb.sides.model_prob.bins[].{bin_lo,bin_hi,n,n_games,gap,gap_ci,significant}, as of 2026-09-16; rows per game is n divided by n_games, a direct ratio of the two published columns.
Rows per game ranges from about 24 to about 49 across the 10 MLB bins, and it is not flat: the two middle bins show 38.6 and 49.4 rows per game against 23.6 in the 0.9-1.0 bin, on more games as well (100 and 114, against 61). A near-even game dwells near a toss-up for long stretches; a bin near 0 or 1 is entered once a game is decided and passed through quickly. The same n in two bins can stand for a different number of independent games. Every ratio is re-computed on the segment-clean corpus; the revision-1 ratios are withdrawn.
Of MLB's 10 model-side bins, 3 have a 95 percent gap interval excluding zero and 7 fall within noise; the market side shows 0 of 10 significant, at a Brier of 0.151008 against the model's 0.166759. Soccer shows a different balance: 8 of its 9 eligible model-side bins exclude zero and 1 falls within noise, with the market at 7 of 9 (Brier 0.195157 against 0.332522). The soccer corpus is smaller (27 games against 178) and its worst series sits higher (minimum 0.4695 model-side, against -0.002 for MLB), so its bins rest on fewer games.
5 Robustness and what would falsify this
- On the ledger's joined corpus both sports land with the game-count anchor below the AR(1) estimate (227 against 761 for MLB, 51 against 172 for soccer). The ledger's confound field states that AR(1) is a first-order approximation of a smooth terminal-constant path rather than a full independence model, and neither figure is published as a bound on the true effective sample size.
- The corpus correction is itself the strongest available check on this paper's claim, and the claim passed: the MLB median lag-1 autocorrelation moved only from 0.9809 to 0.9713 when segmentation excluded 51,635 of 78,986 MLB ticks, so the dependence being measured is a property of how probability paths move, not of the join defect.
- residual_autocorrelation.json skips a duplicate mlb_clean corpus as byte-identical to mlb, so the counts above are not double-counting one source under two labels.
- Floors bound both ledgers: 4 MLB series were skipped as low_n and 1 as flat on each side, leaving 173 of 178, and calibration_stability.json will not report a bin built from fewer than 5 games -- which now bites, since one soccer bin per side falls below that floor. Both record what they dropped rather than thinning silently.
What would falsify the reading that n overstates independent support: if rows per game were close to 1 across bins, or if the published lag-1 autocorrelation were near zero, a row would behave like an independent draw. Neither holds on either corpus.
6 Limitations
- ess_ledger.json was not regenerated on the segment-clean corpus, so its row counts, rho values, ESS figures and interval-width factors describe the joined corpora and are not current; no recomputed replacement is published, and none is estimated here.
- The AR(1) approximation is a first-order model of a path the ledger itself calls smooth and terminal-constant, so the true independent information could sit below 761 for MLB and 172 for soccer -- which is why the ledger anchors on the game count instead.
- The distinct-game anchor treats every game as equally informative regardless of how long it lingers in a state, so it does not carry the rows-per-game variation shown in the bin table.
- These artifacts cover one MLB corpus (178 files, 173 usable series per side) and one international-soccer corpus (27 files, 26 usable per side); no NBA or tennis ledger is cited here.
- The cluster bootstrap corrects the width of a bin's confidence interval, not the number of rows behind its point estimate, which is still computed once over all rows.
- The three artifacts are still not dated from one run: residual_autocorrelation.json and calibration_stability.json were rebuilt as of 2026-09-16, while ess_ledger.json remains at 2026-07-25. The segment-clean corpus is also the output of one segmentation rule applied once.
7 How to read this on the site
The observation-dependence inspector (/analytics/observation-dependence) shows the full published within-game residual-autocorrelation distribution behind the first table and the figure above, sport by sport and side by side. The calibration inspector (/analytics/calibration) shows the reliability bins themselves with their already-applied game-cluster interval, and its own prerequisite points a reader to the effective-sample-size finding first. Read the in-game join-integrity finding alongside any effective-sample-size figure here, because the ledger those figures come from still describes the pre-correction corpus.
Evidence
- residual_autocorrelation.jsonas_of 2026-09-16Source path: /analytics/m/residual_autocorrelation/
Evidence field inventory (28 paths)
- method
- floors.min_rows_per_game
- floors.min_residual_variance
- sports.mlb.n_records
- sports.mlb.n_series
- sports.mlb.n_files
- sports.mlb.model.n_games
- sports.mlb.model.median
- sports.mlb.model.mean
- sports.mlb.model.min
- sports.mlb.model.share_ge_0_9
- sports.mlb.model.skipped.low_n
- sports.mlb.model.skipped.flat
- sports.mlb.market.n_games
- sports.mlb.market.median
- sports.mlb.market.share_ge_0_9
- sports.soccer_intl.n_records
- sports.soccer_intl.n_series
- sports.soccer_intl.model.n_games
- sports.soccer_intl.model.median
- sports.soccer_intl.model.min
- sports.soccer_intl.model.share_ge_0_9
- sports.soccer_intl.market.n_games
- sports.soccer_intl.market.median
- sports.soccer_intl.market.share_ge_0_9
- skipped[].sport
- skipped[].reason
- verdict
- ess_ledger.jsonas_of 2026-07-25T11:12:42.584390+00:00Source path: /analytics/m/ess_ledger/
Evidence field inventory (19 paths)
- headline
- formula
- confound
- corpora[sport=mlb].n_rows
- corpora[sport=mlb].n_games
- corpora[sport=mlb].rho_model
- corpora[sport=mlb].rho_market
- corpora[sport=mlb].ess_ar1
- corpora[sport=mlb].ess_anchor
- corpora[sport=mlb].infl_ar1
- corpora[sport=mlb].infl_anchor
- corpora[sport=soccer_intl].n_rows
- corpora[sport=soccer_intl].n_games
- corpora[sport=soccer_intl].rho_model
- corpora[sport=soccer_intl].rho_market
- corpora[sport=soccer_intl].ess_ar1
- corpora[sport=soccer_intl].ess_anchor
- corpora[sport=soccer_intl].infl_ar1
- corpora[sport=soccer_intl].infl_anchor
- calibration_stability.jsonas_of 2026-09-16Source path: /analytics/m/calibration_stability/
Evidence field inventory (31 paths)
- n_boot
- ci_pct
- cluster_unit
- min_games_per_bin_floor
- method
- seed
- sports.mlb.n_rows
- sports.mlb.n_games
- sports.mlb.sides.model_prob.brier
- sports.mlb.sides.model_prob.n_eligible_bins
- sports.mlb.sides.model_prob.n_significant_bins
- sports.mlb.sides.model_prob.n_within_noise_bins
- sports.mlb.sides.model_prob.bins[].bin_lo
- sports.mlb.sides.model_prob.bins[].bin_hi
- sports.mlb.sides.model_prob.bins[].n
- sports.mlb.sides.model_prob.bins[].n_games
- sports.mlb.sides.model_prob.bins[].gap
- sports.mlb.sides.model_prob.bins[].gap_ci
- sports.mlb.sides.model_prob.bins[].significant
- sports.mlb.sides.market_prob.brier
- sports.mlb.sides.market_prob.n_significant_bins
- sports.mlb.sides.market_prob.n_within_noise_bins
- sports.soccer_intl.n_rows
- sports.soccer_intl.n_games
- sports.soccer_intl.sides.model_prob.brier
- sports.soccer_intl.sides.model_prob.n_significant_bins
- sports.soccer_intl.sides.model_prob.n_within_noise_bins
- sports.soccer_intl.sides.market_prob.brier
- sports.soccer_intl.sides.market_prob.n_significant_bins
- sports.soccer_intl.sides.market_prob.n_within_noise_bins
- verdict