Research paper
Home and away, taken apart
What the home_away_anatomy artifact decomposes for the NBA, why it never publishes a home win rate, and why it cannot be read against another sport's venue artifact on one axis
Abstract
The home_away_anatomy artifact is a player-game decomposition of NBA box-score production by venue, not a decomposition of game outcomes and not a cross-sport comparison. It pools 74,450 valid player-game rows across the 2023-24, 2024-25 and 2025-26 seasons (37,401 home rows, 37,049 away rows) and reports two kinds of number: pooled home-minus-away means for fifteen box-score categories, and a per-player home-minus-away points-per-game distribution restricted to the 543 players with at least 15 games on each side, pooled across the three seasons. The largest pooled counting-stat gap is blocks, 3.786 percent relative to the away mean, on a raw difference of 0.0175 per player-game; the largest shooting gap is free-throw percentage, 78.693 percent at home against 77.927 percent away, a 0.766 percentage-point difference. Only 51.57 percent of the 543 qualified players scored more at home than away, barely above an even split. None of this is a win rate, and the artifact never publishes one. The international-soccer artifact soccer_home_advantage does publish a home win rate -- 0.5074 on 36,350 true-home matches against 0.4418 on 13,075 neutral-site matches -- but at match grain against completed outcomes, not player-game production, so the two artifacts cannot be read on one shared axis. Every rate below is a historical frequency over games or player-games that already happened, not a forecast for a game still to be played.
1 Question
The home_away_anatomy module sits on the site next to a soccer module with a similar-sounding name, soccer_home_advantage, and the natural reading is that the two let a reader line up home advantage across the NBA and international soccer on one chart. This paper checks that reading against what each artifact actually reports before anyone draws the chart.
home_away_anatomy is built from player-game rows: every row is one player's box score in one game, tagged with a verified home/away flag. It measures differences in box-score production -- points, rebounds, shooting percentage and more -- between the games a player, or the pooled league, played at home versus away. It does not measure whether the home team won. soccer_home_advantage measures a different kind of quantity: built at match grain, it reports win, draw and away-win rates, which are outcome frequencies, split on each match's real recorded neutral-site flag. It says nothing about any individual player's production, and NBA's artifact says nothing about who won a game.
2 Data and definitions
home_away_anatomy starts from 77,744 raw player-game rows and drops 3,294 for an invalid venue flag or an unresolved player id, leaving 74,450 valid rows across three seasons with a verified venue flag: 2023-24, 2024-25 and 2025-26. Of those, 37,401 rows are home appearances and 37,049 are away appearances, close to even because a completed schedule pairs one home appearance with one away appearance for every game played.
Two floors gate what gets published. A league-level floor of at least 500 rows per side applies to every season-by-stat cell, and every one of the three seasons clears it. A player-level floor of at least 15 games on each side gates the player-distribution and booster lists. The artifact records that these floors were fixed before the numbers were produced, not tuned to the output.
The by-season and pooled player counts are two different populations, not the same number split three ways. The by-season lists count 351, 392 and 387 qualifying players in 2023-24, 2024-25 and 2025-26 respectively, counting a player again in every season he clears the floor -- summing to 1,130. The pooled list counts 543 unique players who clear the floor over the combined three-season window, well below that sum because most qualifying players appear in more than one season's count.
soccer_home_advantage is a different corpus entirely: 49,425 international matches from 1872-11-30 through 2026-06-16, described in the artifact as the full committed corpus rather than a rolling window. It splits on each match's recorded neutral flag into 36,350 true-home matches and 13,075 neutral-site matches.
Dates: the site's module listing carries no as_of date for home_away_anatomy (not published). soccer_home_advantage is dated 2026-07-25.
3 Method
For home_away_anatomy, the league-level gap is an unweighted mean difference over player-game appearances, and the relative gap restates that difference against the away mean. Shooting percentages pool makes and attempts within a venue before dividing -- not a mean of per-player percentages. The player-level gap is simply one player's home points-per-game minus away points-per-game, subject to the 15-game floor on each side.
league_delta(stat) = home_mean(stat) - away_mean(stat); rel_delta_pct(stat) = 100 * league_delta(stat) / away_mean(stat)
The artifact's own methodology states three things this is not: it is not a forecast for a game that has not been played, since every row is a completed game; it is not the team-level home-court scoring margin sometimes quoted for a league, because this is the smaller per-player-game figure; and it is not adjusted for minutes, pace, rest, opponent or role, so every gap above is a raw, unweighted mean difference.
soccer_home_advantage's split works differently. It uses each match's real recorded neutral flag -- described in the artifact as the natural control, not a random assignment -- to divide matches into true-home and neutral-site groups, then compares win, draw and away-win rates and goal difference within era and tournament-type subgroups.
Neither artifact publishes a confidence interval on any of these figures. Both are complete summaries over their stated corpora -- every valid row, or every match in the observation window -- rather than a sample drawn from a larger population and resampled, so no interval column should be expected below.
4 Results
Read the two artifacts side by side and the mismatch is immediate.
| Sport (artifact) | What the rate measures | Value | n | 95 percent interval |
|---|---|---|---|---|
| NBA (home_away_anatomy) | Share of qualified players with a higher home PPG than away PPG, pooled 2023-24 through 2025-26 | 0.5157 | 543 players | not published |
| Soccer, international (soccer_home_advantage) | Home win rate, true-home matches | 0.5074 | 36,350 matches | not published |
| Soccer, international (soccer_home_advantage) | Home win rate, neutral-site matches | 0.4418 | 13,075 matches | not published |
Source: home_away_anatomy.json pooled.player_distribution.share_positive and n_players, as of date not published; soccer_home_advantage.json venue.true_home and venue.neutral, as of 2026-07-25. NBA and soccer rows use different units, a share of players versus a share of matches, and are not comparable on a common definition.
NBA's closest thing to a rate is not a win rate at all: it is the 0.5157 share of the 543 pooled qualified players who scored more points per game at home than away, barely above an even split. Soccer's home win rate is a genuine outcome rate, falling from 0.5074 on true-home matches to 0.4418 on neutral-site matches. The two numbers describe different objects -- a share of players and a share of matches -- and the data provides no bridge between them, so the table above is not a ranking of which sport has more home advantage.
| Box-score component | Home mean | Away mean | Raw gap (home minus away) | Relative gap |
|---|---|---|---|---|
| Points | 10.949 | 10.868 | 0.081 | 0.746% |
| Rebounds | 4.1579 | 4.1512 | 0.0067 | 0.162% |
| Offensive rebounds | 1.0356 | 1.0514 | -0.0158 | -1.503% |
| Defensive rebounds | 3.1222 | 3.0997 | 0.0225 | 0.726% |
| Assists | 2.5504 | 2.5017 | 0.0487 | 1.947% |
| Steals | 0.7516 | 0.764 | -0.0124 | -1.624% |
| Blocks | 0.4784 | 0.4609 | 0.0175 | 3.786% |
| Turnovers | 1.2602 | 1.2776 | -0.0173 | -1.356% |
| Personal fouls | 1.7804 | 1.8113 | -0.0309 | -1.706% |
Source: home_away_anatomy.json pooled.league_deltas. Unweighted player-game appearance means, not pace-, minutes-, opponent- or rest-adjusted.
Every published component is a small gap relative to its own mean. The largest relative gap is blocks, 3.786 percent (0.0175 per player-game); the largest negative is offensive rebounds, -1.503 percent (-0.0158 per player-game). Points, the category most often quoted informally, sits in the middle at 0.746 percent, 0.081 points per player-game.
| Shot type | Home | Away | Gap (percentage points) |
|---|---|---|---|
| Field goal | 47.479% | 46.833% | 0.647 pp |
| Three-point | 36.632% | 35.867% | 0.765 pp |
| Free throw | 78.693% | 77.927% | 0.766 pp |
Source: home_away_anatomy.json pooled.league_shooting_pct. Pooled sum(makes)/sum(attempts) per venue, not a mean of per-player percentages.
Shooting gaps run in the same direction across all three shot types, largest at the free-throw line: 78.693 percent at home against 77.927 percent away, a 0.766 percentage-point gap.
| Season | Player-games (n) | Home PPG | Away PPG | Relative gap |
|---|---|---|---|---|
| 2023-24 | 23,814 | 11.4014 | 11.2488 | 1.356% |
| 2024-25 | 26,166 | 10.6643 | 10.6461 | 0.171% |
| 2025-26 | 24,470 | 10.8141 | 10.734 | 0.746% |
Source: home_away_anatomy.json by_season.<season>.league_deltas.pts and by_season.<season>.coverage.n_rows. Each season individually clears the artifact's 500-row league floor.
The relative points gap is 1.356 percent in 2023-24, falls to 0.171 percent in 2024-25, and rises to 0.746 percent in 2025-26. Three seasons is not enough rows of a season-level series to call this a trend in either direction; it is three points that do not sit on one line.
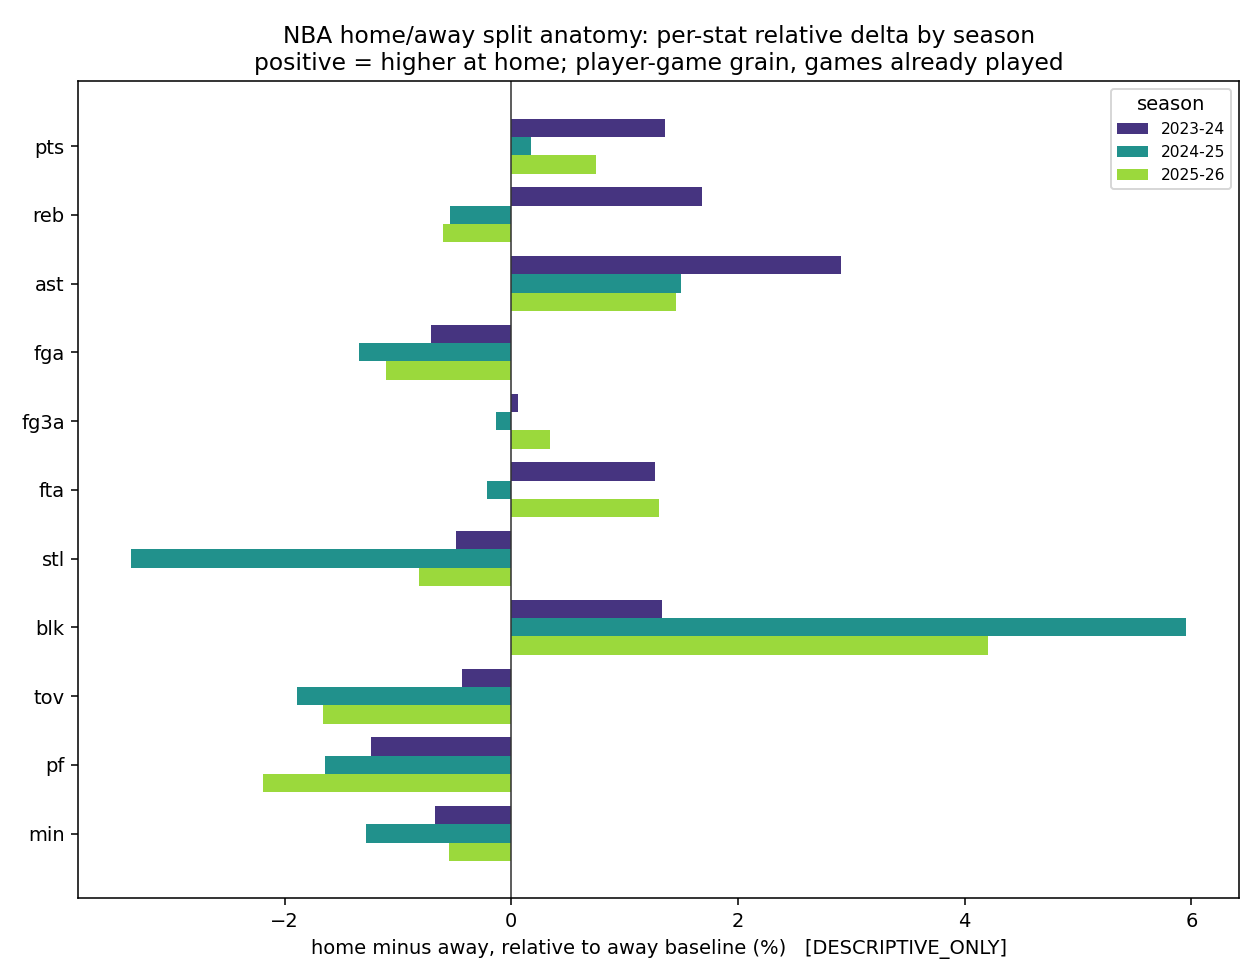
Home-away anatomy: pooled box-score and shooting splits over 74,450 NBA player-games, 2023-24 through 2025-26.
| Player | Home PPG | Away PPG | Home minus away | Home games (n) | Away games (n) |
|---|---|---|---|---|---|
| Ace Bailey (largest home gain) | 15.54 | 11.74 | 3.808 | 35 | 34 |
| Cedric Coward | 14.9 | 11.25 | 3.653 | 31 | 28 |
| Derik Queen | 13.24 | 9.78 | 3.459 | 38 | 36 |
| Kon Knueppel (largest road gain) | 17.05 | 20.87 | -3.814 | 37 | 38 |
| Malachi Flynn | 3.87 | 7.21 | -3.334 | 39 | 34 |
| Tyrese Proctor | 3.59 | 6.57 | -2.979 | 27 | 21 |
Source: home_away_anatomy.json pooled.top_home_boosters and pooled.top_road_boosters.
Individual variation swamps the league mean. Ace Bailey's 35 home and 34 away games produced a 3.808-point home-minus-away gap, and Kon Knueppel's 37 home and 38 away games produced a 3.814-point gap the other way -- both far larger in magnitude than the 0.081-point pooled league mean, and both still counted on samples of well under a full season per side.
| Venue category | Matches (n) | Home win rate | Draw rate | Away win rate | Goal difference |
|---|---|---|---|---|---|
| True-home | 36,350 | 0.5074 | 0.2286 | 0.2640 | 0.6744 |
| Neutral-site | 13,075 | 0.4418 | 0.2242 | 0.3339 | 0.3007 |
Source: soccer_home_advantage.json venue.true_home and venue.neutral, as of 2026-07-25. Goal difference is published per match as it stands in the artifact; positive values are consistent with the home-listed side outscoring the away-listed side on average.
| Era | True-home matches (n) | Neutral matches (n) | True-home goal diff | Neutral goal diff | Effect (true-home minus neutral) |
|---|---|---|---|---|---|
| pre-2000 | 18,235 | 5,827 | 0.6743 | 0.4556 | 0.2187 |
| 2000+ | 18,115 | 7,248 | 0.6745 | 0.1760 | 0.4985 |
Source: soccer_home_advantage.json by_era.
soccer_home_advantage's own hfa_effect field already restates the true-home-minus-neutral gap for the reader: 0.0656 on the home win rate and 0.3737 on goal difference. Splitting by era shows the goal-difference effect growing from 0.2187 before 2000 to 0.4985 from 2000 on, and the artifact's own headline attributes that growth to a falling neutral-site goal difference (0.4556 to 0.1760) rather than a rising true-home one (0.6743 to 0.6745, essentially flat).
5 Robustness and what would falsify this
The soccer artifact lists its own confounds directly. Neutral-site matches concentrate in tournament finals: 8,747 of the 13,075 neutral matches sit in the Finals and continental bucket, so the true-home-versus-neutral contrast is partly a stage-of-competition contrast, not a controlled venue-only comparison. Crowd presence is never directly observed in the source table, there is no strength-of-schedule or opponent-quality adjustment, and draws are folded into the win-rate base rather than excluded.
On the NBA side, the artifact flags a known data issue: diacritic-split player ids from an upstream name-join defect can fragment one player's games across two ids, which can understate a real player's true games-played count in the qualified-player and booster lists without necessarily removing him from the 15-game floor.
What would change either reading: a fourth and fifth NBA season with the points gap continuing to move in one direction, rather than oscillating between 0.171 and 1.356 percent, would turn the season table from a wobble into a trend. For soccer, a neutral-site sample with the finals-heavy concentration removed -- more neutral group-stage matches added -- would show whether the era effect survives outside of high-stakes fixtures or is partly an artifact of which matches happen to be neutral.
6 Limitations
- home_away_anatomy reports unweighted player-game means; it is not adjusted for minutes, pace, opponent strength, rest or role, so a raw home-away gap is an association, not an isolated venue effect.
- The pooled 543-player dispersion population and the by-season 351, 392 and 387 player counts are different populations (unique pooled players versus repeated season memberships) and should not be summed or averaged into one trend.
- home_away_anatomy and soccer_home_advantage use different grains (player-game means versus match outcome rates) and different sports, so no number in one artifact can be subtracted from or ranked against a number in the other.
- Neither artifact publishes a confidence interval on its point estimates, so a gap such as the 0.081-point pooled scoring difference or the 0.0656 home-win-rate effect cannot be read against a stated uncertainty band.
- soccer_home_advantage's neutral-site matches concentrate in tournament finals (8,747 of 13,075), so the true-home-versus-neutral contrast is confounded with competition stage rather than isolating venue alone.
- A known diacritic-split player-id issue in the NBA source can fragment one player's games across two ids, which can understate a real player's games-played count in the qualified-player and booster lists.
7 How to read this on the site
The home_away_anatomy module page carries the full artifact; the figure above links to it directly. Start with pooled.league_deltas and pooled.league_shooting_pct for the league-wide splits, then pooled.player_distribution for how much individual players vary around that pooled mean, and only then pooled.top_home_boosters and pooled.top_road_boosters for the named extremes -- reading them in that order keeps a 35-game individual swing from being mistaken for the league pattern.
soccer_home_advantage lives at its own module page, dated 2026-07-25. The calibration inspector is a useful next stop for a related but different question this paper does not answer: whether a forecast that uses splits like these as an input ends up reliable, which is a question about a model's output, not about the historical splits reported here.
The related analyses below restate these same pooled.league_deltas and league_shooting_pct numbers as sortable per-season and per-category rows: nba-venue-shooting-gap for the three shooting percentages, nba-venue-box-profile for the fifteen box-score categories, and nba-player-venue-dispersion for the player-level distribution. soccer-home-away-trailing-form-gap applies a comparable home-versus-away framing to team-level trailing scoring form rather than match outcomes, which is a third distinct definition again.
Evidence
- home_away_anatomy.jsondate not publishedSource path: /analytics/m/home_away_anatomy/
Evidence field inventory (51 paths)
- input_coverage.rows_valid
- input_coverage.rows_raw
- input_coverage.rows_dropped_invalid_venue_or_id
- input_coverage.n_home_rows
- input_coverage.n_away_rows
- input_coverage.seasons_with_venue_flag
- methodology.floors.player_games_each_side
- methodology.floors.league_min_side_rows
- methodology.floors_tuned_to_output
- methodology.known_data_issue
- methodology.not_this
- by_season[].coverage.n_rows
- by_season[].coverage.n_home
- by_season[].coverage.n_away
- by_season[].coverage.meets_league_floor
- by_season[].league_deltas.pts.home_mean
- by_season[].league_deltas.pts.away_mean
- by_season[].league_deltas.pts.delta
- by_season[].league_deltas.pts.rel_delta_pct
- by_season[].player_distribution.n_players
- pooled.league_deltas.pts
- pooled.league_deltas.reb
- pooled.league_deltas.oreb
- pooled.league_deltas.dreb
- pooled.league_deltas.ast
- pooled.league_deltas.stl
- pooled.league_deltas.blk
- pooled.league_deltas.tov
- pooled.league_deltas.pf
- pooled.league_shooting_pct.fg_pct
- pooled.league_shooting_pct.fg3_pct
- pooled.league_shooting_pct.ft_pct
- pooled.player_distribution.n_players
- pooled.player_distribution.share_positive
- pooled.player_distribution.mean_delta
- pooled.player_distribution.std_delta
- pooled.player_distribution.p10_delta
- pooled.player_distribution.median_delta
- pooled.player_distribution.p90_delta
- pooled.top_home_boosters[].player_name
- pooled.top_home_boosters[].home_minus_away_ppg
- pooled.top_home_boosters[].home_ppg
- pooled.top_home_boosters[].away_ppg
- pooled.top_home_boosters[].n_home
- pooled.top_home_boosters[].n_away
- pooled.top_road_boosters[].player_name
- pooled.top_road_boosters[].home_minus_away_ppg
- pooled.top_road_boosters[].home_ppg
- pooled.top_road_boosters[].away_ppg
- pooled.top_road_boosters[].n_home
- pooled.top_road_boosters[].n_away
- soccer_home_advantage.jsonas_of 2026-07-25Source path: /analytics/m/soccer_home_advantage/
Evidence field inventory (29 paths)
- observation_window.n_matches_played
- observation_window.first_date
- observation_window.last_date
- venue.true_home.n
- venue.true_home.home_win_rate
- venue.true_home.draw_rate
- venue.true_home.away_win_rate
- venue.true_home.goal_diff
- venue.neutral.n
- venue.neutral.home_win_rate
- venue.neutral.draw_rate
- venue.neutral.away_win_rate
- venue.neutral.goal_diff
- hfa_effect.goal_diff
- hfa_effect.home_win_rate
- by_era[].era
- by_era[].true_home_goal_diff
- by_era[].neutral_goal_diff
- by_era[].effect_goal_diff
- by_era[].n_true_home
- by_era[].n_neutral
- by_tournament_type[].bucket
- by_tournament_type[].n
- by_tournament_type[].true_home_n
- by_tournament_type[].neutral_n
- confounds
- travel_leg.testable
- travel_leg.note
- method