Home court, dissected: a thin, mostly-shooting advantage
Descriptive only
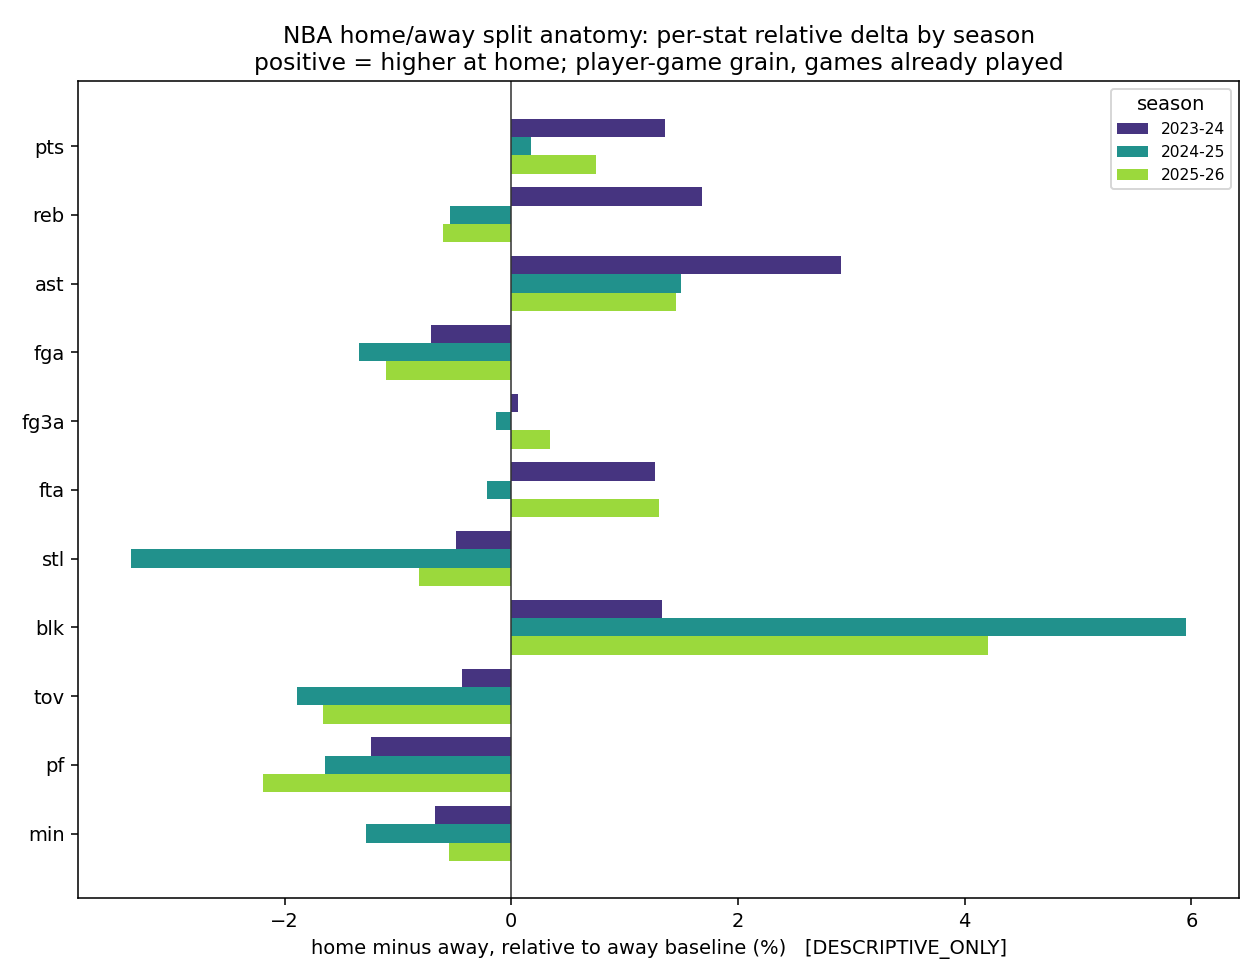
How to read this figure
league_shooting_pct gives the pooled home-vs-away percentages and their point gaps; player_distribution shows how the home-minus-away scoring gap is spread across 543 players (median near zero).
What it means
Breaking home court into its statistical parts shows it is not a scoring explosion -- it is a sliver of extra shooting accuracy (field goal, three, and free-throw percentages all tick up a fraction of a point at home) plus tiny bumps in assists and blocks. The per-player point distribution is nearly centered on zero, meaning 'home cooking' is a faint, league-wide tilt rather than a big individual boost for most players.
Caveats and confounds
Descriptive only. Known data issue: diacritic-split player_ids (an upstream name-join bug) can fragment one player across two ids, unfixed here; floors require 15 player-games per side.