Why Attribution
What it means
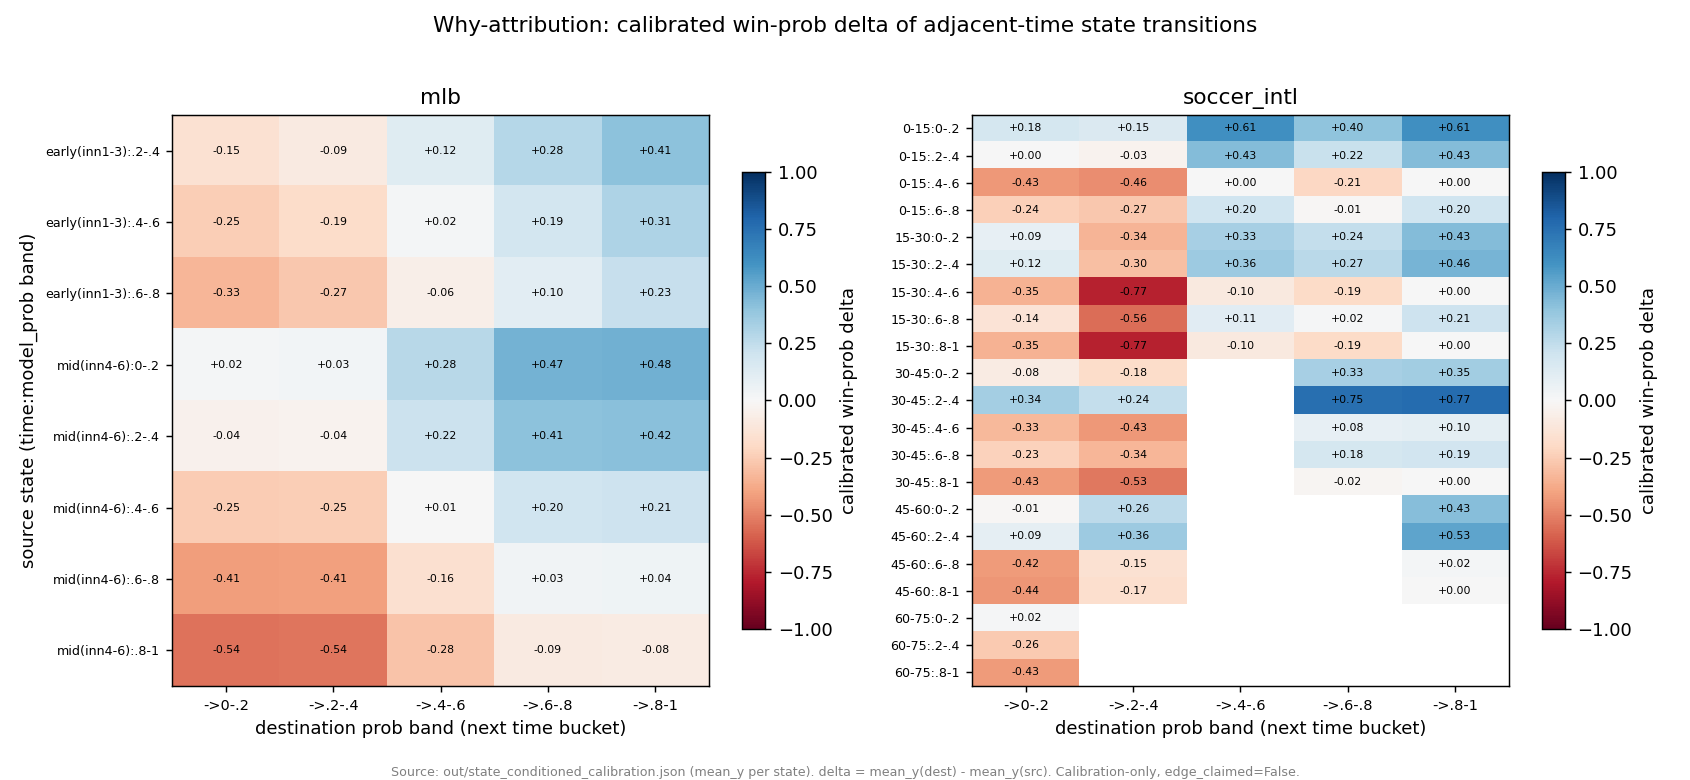
Any in-game probability move can be decomposed into the adjacent time-bucket transition it crossed, with impact measured as the difference in realized win rate between the two states rather than an observed frequency. MLB's biggest drop is a mid-game .8-1 team collapsing to 0-.2 late, worth -0.5395.
Caveats & confounds
mean_y is treated as the calibrated win prob; transitions are restricted to consecutive buckets with no skipping; buckets thinner than n=30 are dropped. NBA is skipped because only a checkpoint-Brier file exists, with no per-state realized win rate to attribute.
Method. For each adjacent-time state transition A->B (source==model buckets, n>=30), attribute win-prob impact as mean_y(B) - mean_y(A) where mean_y is the state's calibrated realized win rate.