Research paper
When a lead lasts
Incidence and timing of margins that persist to the last recorded score tick, MLB and international soccer
Abstract
This paper asks a narrow, descriptive question about game flow: once a scoring margin opens to a given size, how often does it hold all the way to the last score tick this system recorded, and when in the game does that become true. The measurement reads only the score path -- no model or market probability -- and 'holds' means to the last recorded tick in this corpus, not a verified true final score, since completeness of the feed beyond that tick is not established here. Across 174 usable MLB games (n_games_raw = 178, four removed by the 10-tick floor), a 2-run gap becomes permanent in 130 games (74.71%), typically by the middle of the 5th inning (median inning 5.0, interquartile range 3.5 to 7.0; median clock fraction of the observed game 0.6283, IQR 0.4211 to 0.8333). Bigger MLB gaps lock in in fewer games: 3 runs in 97 games (55.75%, median inning 6.0), 4 runs in 74 games (42.53%, median inning 6.5), 5 runs in 55 games (31.61%, median inning 6.0, IQR 4.0 to 7.5). Across 26 usable international soccer games (27 raw), only the 1-goal threshold clears the artifact's own 10-game floor: it becomes permanent in 12 games (46.15%, median minute 37.0, IQR 21.25 to 53.5). The 2-goal (3 of 26 decided) and 3-goal (0 of 26 decided) soccer cells sit below that floor and are masked from any headline number. Innings and minutes are separate clocks on separate sports and are never pooled into one distribution.
1 Question
Broadcasters and viewers both use the intuition that a game is 'effectively over' once one side's lead gets big enough, well before the literal final tick. This paper does not assert that intuition -- it measures it, on the score path alone, for two sports where the underlying artifact carries per-game score ticks: MLB and international soccer.
Two things need pinning down before any number means anything. First, 'persists' means persists to the last score tick this system recorded for that game, not to a confirmed true final score; a feed that stopped short of a game's real end would have its in-progress margin read as permanent, and that truncation is invisible to this method. Second, a threshold is checked once it is reached: from the first tick where the absolute margin is at or above the threshold, does it ever drop back below at any later recorded tick in that game.
Two quantities follow from that definition, per (sport, threshold) pair. Incidence: in what fraction of games does the threshold ever become permanent in this sense (n_games_decided over n_games_total). Timing: conditional on it happening, when -- in the sport's own clock unit and as a fraction of that game's own observed length.
2 Data and definitions
The source artifact is webapp/public/data/showcase/blowout_dynamics.json, published on the site as the blowout_dynamics module (site_manifest.json lists it with status 'partial' and as_of 2026-09-17). A companion summary card at webapp/public/data/insights/blowout_dynamics.json restates the headline pattern in prose; the per-threshold quartiles used in this paper come from the showcase artifact's thresholds arrays, which the insight card does not carry in full.
Corpora: MLB has n_games_raw = 178 and n_games_usable = 174; international soccer has n_games_raw = 27 and n_games_usable = 26. Both sports share a per-game floor, min_ticks_floor = 10: a game with fewer than 10 recorded score ticks is excluded from the corpus entirely, before any threshold is checked. That floor is what separates raw from usable here, removing four MLB games and one soccer game.
Each (sport, threshold) cell in the thresholds array carries n_games_total, n_games_decided, and decided_frac_of_games (the incidence rate). When a cell clears the artifact's separate floors.min_games_per_threshold = 10 (at least 10 games decided at that threshold), it additionally carries decided_clock_median, decided_clock_p25, decided_clock_p75, decided_clock_mean -- in the sport's native clock unit -- and decided_clockfrac_median / p25 / p75, a fraction of that same game's own final recorded clock value.
decided_clockfrac = decided_clock / final_recorded_clock (same game, same units)
The floors are declared once in the artifact itself (floors.min_ticks_per_game = 10, floors.min_games_per_threshold = 10) and applied uniformly to every cell, with the artifact's own note that they are 'declared once, not tuned to output.' A cell below the games floor keeps its raw counts but has no clock-timing fields and carries masked_below_floor = true. This paper reports those raw counts and marks the cell masked; it reports no median or IQR for them, because the artifact computes none.
One source key, mlb_clean, was present upstream and is listed in the artifact's own skipped array as a byte-identical duplicate of mlb; it was not loaded and is not double-counted in the 174-game MLB denominator used throughout this paper.
3 Method
Per game, the module orders every recorded score tick by (game-clock, timestamp) and finds, for each margin threshold, the first tick from which the absolute margin between the two sides stays at or above that threshold for every subsequent recorded tick through the last one. That first tick is the threshold's point of no return for that game. If the margin never reaches the threshold, or reaches it but later falls back below it at some later recorded tick, the game contributes to n_games_total but not to n_games_decided for that threshold.
This is a read of the score path only. It does not touch any model output or market price, and it does not distinguish why a margin held (a blowout that never got close again versus a comeback that fell just short) -- it only asks whether the margin, once opened to the threshold, was ever crossed back.
Units are sport-specific and are never pooled: MLB's clock_field is inning, international soccer's is minute. A median inning number and a median minute number are different unit systems and are always reported and read separately in this paper; nowhere below is an inning count averaged with, compared against, or converted to a minute count, and no claim is made that one sport's leads lock in 'faster' or 'slower' than the other's in real time.
4 Results
MLB, all four thresholds above the games floor, from webapp/public/data/showcase/blowout_dynamics.json sports.mlb.thresholds:
| Threshold (runs) | Decided / total (n) | Incidence (%) | Median clock (inning) | P25-P75 (inning) | Median clock fraction |
|---|---|---|---|---|---|
| 2 | 130 / 174 | 74.71 | 5.0 | 3.5-7.0 | 0.6283 |
| 3 | 97 / 174 | 55.75 | 6.0 | 4.0-7.5 | 0.7368 |
| 4 | 74 / 174 | 42.53 | 6.5 | 4.125-7.5 | 0.8153 |
| 5 | 55 / 174 | 31.61 | 6.0 | 4.0-7.5 | 0.8182 |
Source: webapp/public/data/showcase/blowout_dynamics.json, sports.mlb.thresholds[]; n_games_usable=174, min_ticks_floor=10.
The incidence side is monotone: a bigger required gap becomes permanent in fewer games, 74.71% down to 31.61% of the same 174-game corpus. The timing side is monotone only on the clock-fraction scale, where the median runs 0.6283 at 2 runs up to 0.8182 at 5 runs. In inning terms it is not: the 5-run median falls back to 6.0 against the 4-run cell's 6.5. Revision 1 read a clean monotone rise on both clocks (medians 6.0 up to 7.5 in innings); that reading depended on the join defect, because two games' score paths concatenated into one file push every point of no return later in the recorded span. The inning IQRs are now nearly identical from the 3-run cell up (4.0-7.5, 4.125-7.5, 4.0-7.5), while the 2-run cell keeps the widest spread (3.5-7.0), consistent with a 2-run gap being reachable, and reversible, across a much larger share of a game's innings than a 5-run gap.
International soccer, from sports.soccer_intl.thresholds:
| Threshold (goals) | Decided / total (n) | Incidence (%) | Median clock (minute) | P25-P75 (minute) | Median clock fraction | Status |
|---|---|---|---|---|---|---|
| 1 | 12 / 26 | 46.15 | 37.0 | 21.25-53.5 | 0.5994 | above floor |
| 2 | 3 / 26 | 11.54 | n/a | n/a | n/a | masked (below 10-game floor) |
| 3 | 0 / 26 | 0.00 | n/a | n/a | n/a | masked (below 10-game floor) |
Source: webapp/public/data/showcase/blowout_dynamics.json, sports.soccer_intl.thresholds[]; n_games_usable=26, min_ticks_floor=10, floors.min_games_per_threshold=10.
For the one supported soccer cell: a 1-goal gap becomes permanent in 12 of 26 games (46.15%), typically around the midpoint of the observed match (median minute 37.0, IQR 21.25 to 53.5), at a median clock fraction of 0.5994 (IQR 0.363 to 0.9201) of that game's own observed length. The wide IQR on both the minute scale and the clock-fraction scale reflects the small n (12 decided games) behind this single cell. Revision 1 read 14 of 29 games at median minute 39.5 and clock fraction 0.7475; the fall in the fraction is the concatenated-file artifact coming out.
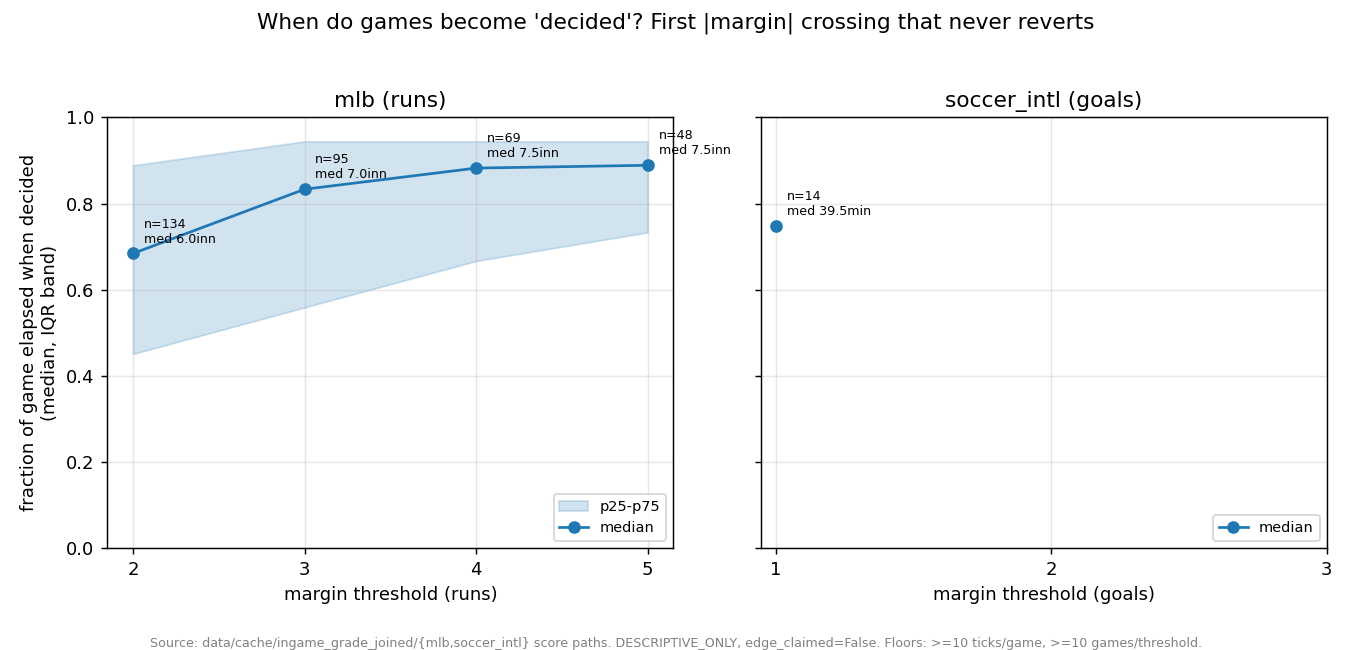
Point-of-no-return incidence and timing by (sport, threshold): MLB thresholds of 2-5 runs and the international-soccer 1-goal threshold; masked cells shown but excluded from the headline pattern.
A separate module on this site, why_attribution, reports numbers that can look superficially similar to the ones above -- a 'from' state and a 'to' state joined by a probability difference -- but it answers a different question and should not be read as a persistence or transition-frequency measurement. Its from/to pair is two adjacent time-probability buckets, each an aggregate over a distinct set of game-observations that happened to sit in that bucket; winprob_delta is the difference between the two buckets' realized win rates, mean_y(B) minus mean_y(A), not the frequency with which any single game moved from state A to state B. On the segment-clean corpus its largest contrast is mlb, mid(inn4-6) at forecast .8-1 (mean_y 0.9651, n=1,462) against late(inn7+) at forecast 0-.2 (mean_y 0.0666, n=2,884), winprob_delta -0.8985 with min_support_n = 1,462 (why_attribution.json biggest_drops[0]). On the joined corpus the largest contrast sat in soccer, so even the sport at the top of that list moved when the population was corrected; the soccer pair revision 1 quoted is still there, minute 15-30 at .4-.6 (mean_y 1.0, n=120) against minute 30-45 at .2-.4 (mean_y 0.225, n=120), winprob_delta -0.775. Either figure is a between-bucket contrast in two different groups' realized outcomes, not evidence that games leading in the earlier bucket went on to lose that lead in the later one.
5 Robustness and what would falsify this
The floors that decide which cells get a headline number (10 ticks per game, 10 decided games per threshold) are declared once in the artifact itself, not chosen after looking at which cells came out clean. That discipline is what lets the 2-goal and 3-goal soccer cells be reported as masked on 3 and 0 decided games, rather than with a spurious median computed from a handful of games.
The mlb_clean duplicate-source check caught and dropped a byte-identical copy of the MLB corpus before it could silently double the denominator; every MLB number in this paper is against that single, de-duplicated count of 178 raw and 174 usable games.
- This would be revised if a larger international-soccer corpus (more than the current 26 usable games) cleared the 10-game floor on the 2-goal or 3-goal thresholds and produced an incidence or median-minute pattern materially different from what the 1-goal cell alone suggests.
- This would be revised if a re-run on a different MLB season or corpus moved the 2-run median outside its own reported IQR (3.5 to 7.0 innings), which would say the 174-game figure here was not representative.
- This would be revised if the last-recorded-tick assumption were checked against verified true final scores and found to differ systematically -- for example if truncated feeds were common and biased the incidence numbers upward by mistaking in-progress margins for permanent ones.
This module carries MLB and international soccer only. The blowout_dynamics artifact's own companion insight card notes that the NBA cut is not present in this artifact, and this paper makes no claim, positive or negative, about basketball lead persistence.
6 Limitations
- Persistence is measured to the last recorded score tick in this corpus, not a verified true final score; a feed that stopped short of a game's real end would be read by this method as a permanent margin, and that possibility is not checked here.
- The international-soccer corpus is 26 usable games, and only the 1-goal threshold clears the artifact's own 10-game floor; the 2-goal (3 of 26 decided) and 3-goal (0 of 26 decided) cells are masked, so no soccer claim above 1 goal is supported by this artifact.
- MLB innings and soccer minutes are different clocks and are never pooled or converted to a common scale here; nothing compares how 'fast' a lead locks in across the two sports.
- This is a descriptive read of the score path, not a model or market probability; it says nothing about forecast calibration, and it is not a statement about how likely a lead was to hold at the moment it opened.
- Only one corpus snapshot is reported here, as_of 2026-09-17 on the source artifact; there is no walk-forward or multi-season replication showing these incidence and timing figures are stable across seasons or competitions.
- Both source artifacts were rebuilt on the segment-clean corpus and neither is under review; the withdrawn revision-1 figures are kept in the timing regeneration receipt, not restated here.
7 How to read this on the site
The blowout-timing inspector on the site renders the same per-threshold incidence and timing table shown above, live from the blowout_dynamics module, including the masked-cell markers. Readers who want the calibration angle rather than this descriptive game-flow angle should go to the state-contrasts and state-reliability inspectors, which carry the why_attribution material referenced above -- keeping the distinction made there in mind: a between-bucket forecast contrast is not a within-game transition.
The figure above draws from the same published blowout_dynamics module cited throughout this paper; masked cells are shown on it for transparency and are visually distinguished from the cells that clear the games floor.
Evidence
- blowout_dynamics.jsonas_of 2026-09-17Source path: /analytics/m/blowout_dynamics/
Evidence field inventory (33 paths)
- as_of
- corpus
- method
- floors.min_ticks_per_game
- floors.min_games_per_threshold
- sports.mlb.n_games_raw
- sports.mlb.n_games_usable
- sports.mlb.min_ticks_floor
- sports.mlb.thresholds[].threshold
- sports.mlb.thresholds[].n_games_decided
- sports.mlb.thresholds[].n_games_total
- sports.mlb.thresholds[].decided_frac_of_games
- sports.mlb.thresholds[].decided_clock_median
- sports.mlb.thresholds[].decided_clock_p25
- sports.mlb.thresholds[].decided_clock_p75
- sports.mlb.thresholds[].decided_clockfrac_median
- sports.mlb.thresholds[].decided_clockfrac_p25
- sports.mlb.thresholds[].decided_clockfrac_p75
- sports.soccer_intl.n_games_raw
- sports.soccer_intl.n_games_usable
- sports.soccer_intl.thresholds[].threshold
- sports.soccer_intl.thresholds[].n_games_decided
- sports.soccer_intl.thresholds[].n_games_total
- sports.soccer_intl.thresholds[].decided_frac_of_games
- sports.soccer_intl.thresholds[].decided_clock_median
- sports.soccer_intl.thresholds[].decided_clock_p25
- sports.soccer_intl.thresholds[].decided_clock_p75
- sports.soccer_intl.thresholds[].decided_clockfrac_median
- sports.soccer_intl.thresholds[].decided_clockfrac_p25
- sports.soccer_intl.thresholds[].decided_clockfrac_p75
- sports.soccer_intl.thresholds[].masked_below_floor
- skipped[].sport
- skipped[].reason
- why_attribution.jsonas_of 2026-09-17Source path: /analytics/m/why_attribution/
Evidence field inventory (12 paths)
- as_of
- corpus
- biggest_drops[].from.time
- biggest_drops[].from.prob
- biggest_drops[].from.mean_y
- biggest_drops[].from.n
- biggest_drops[].to.time
- biggest_drops[].to.prob
- biggest_drops[].to.mean_y
- biggest_drops[].to.n
- biggest_drops[].winprob_delta
- biggest_drops[].min_support_n