Research paper
Where the forecast errors live
Residual anatomy of MLB and international-soccer win forecasts, by game-state time bucket and forecast-probability band
Abstract
We decompose forecast error for two segment-clean in-game corpora -- MLB (27,351 rows, 178 files) and international soccer (4,265 rows, 27 files) -- into cells crossing a game-state time bucket with a five-band forecast-probability split, using residual_anatomy.json's mean_abs_residual (the average |forecast - outcome| per row, a rate) and total_abs_residual_mass (that rate times the cell's row count, a sum). After dropping rows with no game-state field (668 of 27,351 for MLB; 882 of 4,265 for soccer), MLB's 13 populated cells hold 26,683 rows and 9,430.39 total residual mass; soccer's 25 cells hold 3,383 rows and 1,579.85. In both sports the largest-mass cell is also the largest-n cell: MLB's early-innings .4-.6 band (n=5,754, mean_abs_residual 0.4888, 29.8 percent of MLB's mass) and soccer's minute-45-60 0-.2 band (n=410, mean_abs_residual 0.5693, 14.8 percent) -- a count effect, since mass scales with n at a fixed per-row rate. The two still differ in why their rate is high: MLB's carries a small aggregate bias (calibration_error 0.0215), consistent with binary-outcome noise near an even-money forecast; soccer's carries a calibration_error of 0.4894, close to its residual, consistent with a real, biased miss. The MLB cell revision 1 used as its bias example no longer qualifies and is withdrawn here. This is a calibration and error-decomposition exercise; it does not measure whether acting on either forecast would have produced a return.
1 Question
Where does a win forecast's error accumulate once a season of graded in-game rows is split into cells by game-state time bucket and forecast-probability band? residual_anatomy.json reports two numbers per cell: mean_abs_residual, the average absolute gap between forecast and outcome for a single row, and total_abs_residual_mass, the sum of that gap across every row in the cell. This paper reads both together and separates count effects in the ranking from larger per-row misses.
This is a calibration and error-decomposition exercise. It does not test whether acting on either forecast would have produced a return, and no between-bucket comparison below describes an observed in-game trajectory.
2 Data and definitions
residual_anatomy.json (as of 2026-09-16) carries, per sport, segments[] rows keyed by time_bucket crossed with prob_bucket (0-.2 through .8-1), each with n, mean_abs_residual and total_abs_residual_mass. MLB starts from 27,351 records across 178 files and drops 668 with no game-state field, leaving 26,683 rows across 13 populated cells; soccer_intl starts from 4,265 across 27 files and drops 882, leaving 3,383 across 25 cells. Both list one skipped source, mlb_clean, a byte-identical duplicate. The story field frames the ranking as the improvement backlog.
Revision 1 read 13 MLB cells holding 52,646 rows and 22,133.62 mass, and 26 soccer cells holding 3,658 rows and 1,643.08; those totals are withdrawn. The MLB cell count is unchanged at 13 and the soccer count fell to 25, so the grid's shape survived the correction while its contents did not.
state_conditioned_calibration.json (as of 2026-09-16) buckets the same rows into the same grid, but keeps model and market as two separately built sources and adds mean_p, mean_y and calibration_error per cell. Its model-side n matches residual_anatomy.json's segments at the same labels -- MLB early(inn1-3)/.4-.6 is n=5,754 in both, and late(inn7+)/.2-.4 is n=617 in both -- so a cell's mass can be read next to its calibration_error without the row-mismatch caution that applies between a model cell and a market cell. Both were rebuilt in the same pass.
why_attribution.json (as of 2026-09-17, source_as_of 2026-09-16) builds 40 MLB and 80 soccer_intl transitions from state_conditioned_calibration.json's model-source buckets, restricted to adjacent time buckets, dropping any bucket with n below 30, and recording winprob_delta alongside a min_support_n floor. NBA is skipped: only a checkpoint Brier exists for it.
3 Method
total_abs_residual_mass(cell) = sum over rows in cell of |forecast_i - outcome_i| = n(cell) x mean_abs_residual(cell)
Ranking cells by mass, as the artifact's own framing does, answers where improving the model would save the most total error; ranking by mean_abs_residual answers which cells are least accurate per forecast. A table of top cells by mass is not a list of the least-accurate cells.
Because the two artifacts agree on n at the cells checked, we pair a cell's mass and mean_abs_residual with its calibration_error to ask whether a high per-row residual reflects aggregate bias (a large calibration_error) or noise around an approximately correct average forecast (a small one). A forecast near 0.5 mechanically produces a large |forecast - outcome| on roughly half its rows whatever its calibration, so mean_abs_residual is not comparable across bands without also reading calibration_error.
why_attribution.json's winprob_delta is a difference between two group means -- mean_y of all rows in the later bucket minus mean_y of all rows in the earlier one -- not a figure computed by following individual games from one bucket into the next, as the artifact's own assumptions say. min_support_n is the smaller of the two buckets' n: a conservative floor on how much data backs a delta, not a count of games that made that move.
4 Results
MLB's 13 populated cells (26683 rows; 668 of 27,351 dropped for no game-state field) hold 9430.39 total residual mass. Table 1 lists all 13, ranked by mass.
| Time bucket | Prob band | n | Mean abs residual | Total abs residual mass | Share of MLB mass |
|---|---|---|---|---|---|
| early(inn1-3) | .4-.6 | 5754 | 0.4888 | 2812.37 | 29.8% |
| early(inn1-3) | .6-.8 | 2702 | 0.4460 | 1204.96 | 12.8% |
| mid(inn4-6) | .4-.6 | 2468 | 0.4794 | 1183.15 | 12.5% |
| mid(inn4-6) | .6-.8 | 2449 | 0.3941 | 965.13 | 10.2% |
| mid(inn4-6) | .2-.4 | 2285 | 0.3647 | 833.40 | 8.8% |
| early(inn1-3) | .2-.4 | 1033 | 0.4153 | 428.99 | 4.5% |
| late(inn7+) | .4-.6 | 820 | 0.4987 | 408.96 | 4.3% |
| late(inn7+) | 0-.2 | 2884 | 0.1325 | 382.13 | 4.1% |
| late(inn7+) | .8-1 | 2369 | 0.1276 | 302.21 | 3.2% |
| late(inn7+) | .6-.8 | 752 | 0.3666 | 275.65 | 2.9% |
| mid(inn4-6) | .8-1 | 1462 | 0.1717 | 251.05 | 2.7% |
| mid(inn4-6) | 0-.2 | 1088 | 0.1765 | 192.06 | 2.0% |
| late(inn7+) | .2-.4 | 617 | 0.3085 | 190.33 | 2.0% |
n sums to 26683 = 27,351 - 668; mass sums to 9430.39.
The largest cell by mass is also the largest by n: early(inn1-3)/.4-.6, with n=5,754 contributing 2,812.37 of mass, 29.8 percent of the MLB total, at a mean_abs_residual of 0.4888 -- a middling rate, not the highest (late(inn7+)/.4-.6 reaches 0.4987 on only n=820 and 4.3 percent of mass). Its state cell shows mean_p=0.5097, mean_y=0.4882, calibration_error=0.0215: a small aggregate bias next to a large per-row residual, the signature of binary-outcome noise near an even forecast. That reading held in revision 1 and holds here.
Revision 1 drew its contrast against MLB's late(inn7+)/.8-1 cell, which then held n=5,037 at a mean_abs_residual of 0.3493 and a calibration_error of 0.2357, read as a confident, systematic miss. On the segment-clean corpus that cell holds n=2,369 at 0.1276 and 0.0397, among the smallest biases in the grid. A near-certain late forecast attached to another game's outcome is the most expensive kind of mislabelled row, so that cell absorbed the defect. The example is withdrawn, not restated at reduced size.
A cell that does still show the bias signature is late(inn7+)/.2-.4: n=617, mean_abs_residual 0.3085, mass 190.33 (2.0 percent of the total). Its state cell shows mean_p=0.2620, mean_y=0.0843, calibration_error=0.1778 -- the bias is a majority of the per-row residual, so this looks like a real, systematic miss rather than noise. It is a small cell with a correspondingly small mass share, which is the point of separating the two rankings.
| Time bucket | n | Share of n | Total abs residual mass | Share of mass | Mass per row |
|---|---|---|---|---|---|
| early(inn1-3) | 9489 | 35.6% | 4446.32 | 47.1% | 0.4686 |
| mid(inn4-6) | 9752 | 36.5% | 3424.79 | 36.3% | 0.3512 |
| late(inn7+) | 7442 | 27.9% | 1559.28 | 16.5% | 0.2095 |
Mass per row = total abs residual mass / n; sums are arithmetic totals of Table 1's per-cell fields.
Early innings carry the most mass (47.1 percent) on both more rows (35.6 percent of n) and a higher per-row rate (0.4686) than mid or late innings (0.3512 and 0.2095); late innings carry 16.5 percent of the mass on 27.9 percent of the rows. The early-inning dominance is not purely a count effect, and the decline is steeper than on the joined corpus, where the three rates read 0.4853, 0.4122 and 0.3392.
soccer_intl's 25 populated cells (3,383 rows; 882 of 4,265 dropped for no game-state field) hold 1,579.85 total residual mass. Table 3 lists the top 10 by mass; the remaining 15, concentrated in the .6-.8 and .8-1 bands, hold the rest.
| Time bucket (min) | Prob band | n | Mean abs residual | Total abs residual mass | Share of soccer mass |
|---|---|---|---|---|---|
| 45-60 | 0-.2 | 410 | 0.5693 | 233.42 | 14.8% |
| 75-90+ | 0-.2 | 367 | 0.5230 | 191.95 | 12.1% |
| 60-75 | 0-.2 | 342 | 0.5322 | 182.03 | 11.5% |
| 30-45 | 0-.2 | 232 | 0.6338 | 147.05 | 9.3% |
| 0-15 | .2-.4 | 264 | 0.4872 | 128.62 | 8.1% |
| 15-30 | .2-.4 | 227 | 0.4795 | 108.84 | 6.9% |
| 15-30 | 0-.2 | 174 | 0.5295 | 92.14 | 5.8% |
| 45-60 | .2-.4 | 216 | 0.3762 | 81.27 | 5.1% |
| 0-15 | .4-.6 | 158 | 0.4944 | 78.12 | 4.9% |
| 15-30 | .4-.6 | 120 | 0.5000 | 60.00 | 3.8% |
Top 10 hold 82.5% of the 1579.85 soccer_intl total; the remaining 15 cells hold 17.5%.
soccer's leading cell, minute 45-60 / 0-.2, is again the largest-n cell in its sport (n=410), contributing 233.42 of mass, 14.8 percent of the total, at mean_abs_residual 0.5693. Unlike MLB's, its state cell shows mean_p=0.0837, mean_y=0.5732, calibration_error=0.4894 -- close to the residual, so its mass mostly reflects a real bias. The next-largest, minute 75-90+ / 0-.2 (n=367, mass 191.95), repeats it: mean_p=0.0658, mean_y=0.5599, calibration_error=0.4941. Both held the same positions in revision 1, at different sizes.
| Time bucket (min) | n | Share of n | Total abs residual mass | Share of mass | Mass per row |
|---|---|---|---|---|---|
| 0-15 | 566 | 16.7% | 261.56 | 16.6% | 0.4621 |
| 15-30 | 595 | 17.6% | 280.14 | 17.7% | 0.4708 |
| 30-45 | 554 | 16.4% | 255.63 | 16.2% | 0.4614 |
| 45-60 | 783 | 23.1% | 338.23 | 21.4% | 0.4320 |
| 60-75 | 495 | 14.6% | 245.56 | 15.5% | 0.4961 |
| 75-90+ | 390 | 11.5% | 198.73 | 12.6% | 0.5096 |
Mass per row = total abs residual mass / n; sums are arithmetic totals of the per-cell fields.
soccer's per-row rate runs from 0.4320 to 0.5096 across the six windows, worst per row in the late ones. Minute 45-60 leads both the n share and the mass share, the count-effect pattern again; minute 75-90+ carries one of the highest rates on a small n share, so its mass share stays modest.
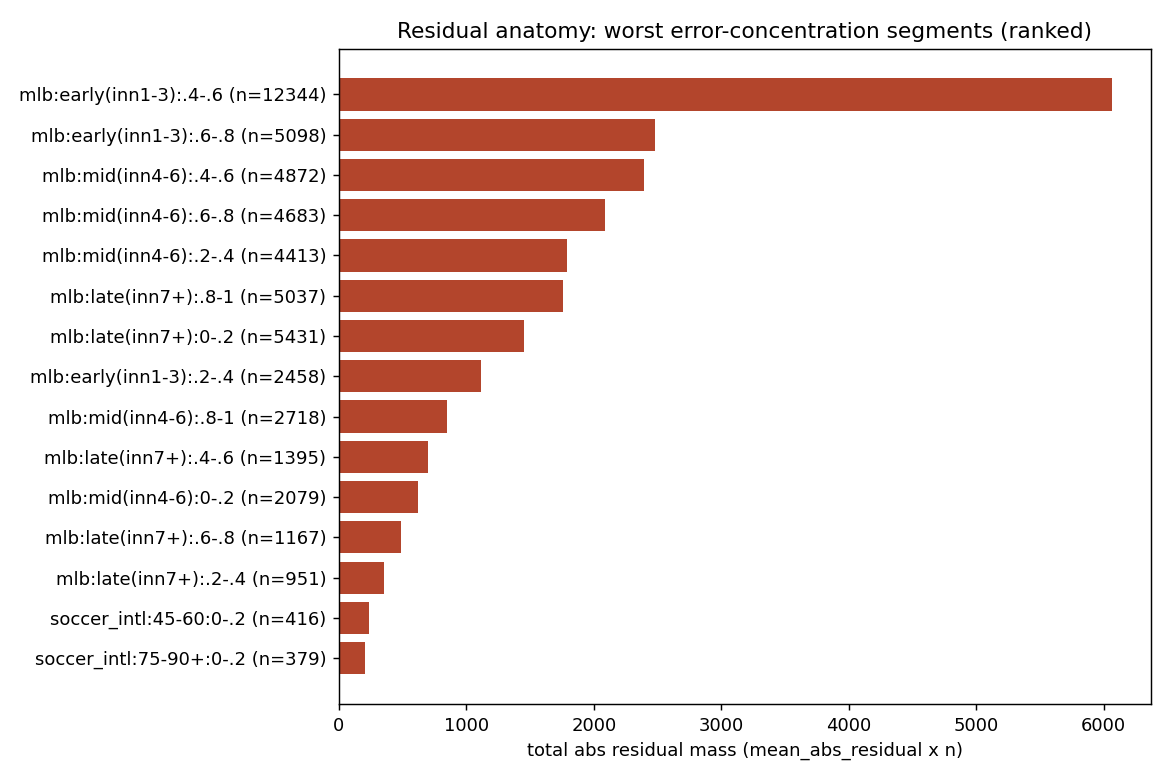
MLB and soccer_intl residual anatomy: mean_abs_residual and total_abs_residual_mass by time bucket x forecast-probability band, from the segments tables above.
why_attribution.json reports winprob_delta = mean_y(to) - mean_y(from) over those transitions. On the segment-clean corpus its largest move is in MLB: mid(inn4-6)/.8-1 (mean_y=0.9651, n=1,462) to late(inn7+)/0-.2 (mean_y=0.0666, n=2,884), winprob_delta=-0.8985 at min_support_n=1,462. Revision 1 put the largest move in soccer at -0.7683; that ranking depended on the join defect. The soccer pair now reads 15-30/.4-.6 (mean_y=1.0, n=120) to 30-45/.2-.4 (mean_y=0.225, n=120), winprob_delta=-0.775.
The method caution on those deltas still applies. None describes a single game moving from one state to the other: each is the difference between the realized win rate of all rows in the earlier bucket and of all rows in the later one, adjacent in time order but not matched game by game. A large contrast says the two states saw different realized outcomes on average; it does not say a game observed in the earlier state has that probability of reaching the later one.
5 Robustness and what would falsify this
- If a later MLB corpus shifted more graded rows into mid or late innings, the mass ranking could reorder with no change in any cell's mean_abs_residual -- the clean test of how much of the ranking is a count effect.
- The corpus correction already ran that test on one cell and the reading failed: MLB's late(inn7+)/.8-1 cell went from this paper's example of systematic bias (calibration_error 0.2357) to one of its smallest (0.0397) with no change to the forecaster. Every cell-level reading here is exposed to the same failure.
- If MLB's early(inn1-3)/.4-.6 calibration_error grew materially above 0.0215 while its mean_abs_residual stayed near 0.49, the noise-dominated reading of that cell would no longer hold.
- soccer_intl's thinnest cells (several under n=50, one at n=7) would either persist or wash out with more games.
- why_attribution.json's cross-sectional deltas would become evidence about actual in-game transitions only if paired with a game_id-linked panel; the rebuild did not add one.
6 Limitations
- Every figure here is revision 2. Segmentation excluded 51,635 of 78,986 MLB ticks (65.4 percent) and 4,738 of 9,003 soccer ticks (52.6 percent); 27,076 MLB ticks (34.3 percent) were the identified label mismatches, the rest going with quarantined files and unlabelled segments. Intervals were re-estimated by game-cluster bootstrap, not widened. The moves against revision 1 are population changes, not evidence that the forecaster improved.
- why_attribution.json was regenerated on 2026-09-17, a day after the two artifacts beside it; its bucket sizes now match the cells it is built from, and none of the three is under review.
- mean_abs_residual and total_abs_residual_mass carry no confidence interval; the mass rankings are point-estimate rankings, and the smaller corpus makes that absence matter more.
- 668 of 27,351 MLB rows and 882 of 4,265 soccer_intl rows are dropped for carrying no game-state field.
- why_attribution.json's winprob_delta is an unpaired difference between two bucket-level group means, not an observed within-game transition, and it drops any bucket with n below 30.
- soccer_intl's cells run as low as n=7, where single-cell numbers are noise-dominated. This is a calibration and error-decomposition exercise and does not measure whether acting on either forecast would have produced a return.
7 How to read this on the site
The segment tables and the figure are drawn from the residual-anatomy inspector, which sorts MLB's 13 and soccer_intl's 25 cells by either measure. The state-reliability inspector holds the matching state cells used here to separate noise from real bias. The state-contrasts inspector holds why_attribution.json's transitions; the in-game join-integrity finding records when each of the three was rebuilt.
Evidence
- residual_anatomy.jsonas_of 2026-09-16Source path: /analytics/m/residual_anatomy/
Evidence field inventory (11 paths)
- story
- sports.mlb.n_records
- sports.mlb.n_files
- sports.mlb.n_skipped
- sports.mlb.segments[]
- sports.soccer_intl.n_records
- sports.soccer_intl.n_files
- sports.soccer_intl.n_skipped
- sports.soccer_intl.segments[]
- skipped[].sport
- skipped[].reason
- state_conditioned_calibration.jsonas_of 2026-09-16Source path: /analytics/m/state_conditioned_calibration/
Evidence field inventory (4 paths)
- sports.mlb.buckets[source=model,time_bucket=early(inn1-3),prob_bucket=.4-.6].n
- sports.mlb.buckets[source=model,time_bucket=late(inn7+),prob_bucket=.8-1].n
- sports.soccer_intl.buckets[source=model,time_bucket=45-60,prob_bucket=0-.2].n
- sports.soccer_intl.buckets[source=model,time_bucket=75-90+,prob_bucket=0-.2].n
- why_attribution.jsonas_of 2026-09-17Source path: /analytics/m/why_attribution/
Evidence field inventory (14 paths)
- as_of
- corpus
- source_as_of
- method
- assumptions[]
- sports.mlb.n_transitions
- sports.mlb.transitions[]
- sports.soccer_intl.n_transitions
- sports.soccer_intl.transitions[]
- biggest_drops[]
- biggest_gains[]
- verdict
- skipped[].sport
- skipped[].reason