Research paper
Five-man lineups, on/off and the active/missed proxy: what NBA lineup evidence can and cannot say
Reading published lineup-synergy residuals, on/off net rating and a Wald active/missed win-rate proxy as description, not forecast
Abstract
This paper reads four published NBA lineup measurements side by side: a five-man lineup-synergy residual, an individual on/off net-rating leaderboard, a team win-rate active/missed proxy, and an on/off rim-deterrence leaderboard, and asks what each describes and what it does not. lineup_synergy.json ranks 102 qualifying 2024-25 five-man units by synergy_residual (observed net per 48 minus an expected net per 48 built from the members' individual on/off deltas); the top residual, a Memphis five named in the artifact's own headline field, runs +24.32 over 25 games and 221.8 minutes, against a published 101.6-to-940.0-minute range across all 102 units. on_off_showcase.json ranks 353 players in 2024-25 (Nikola Jokic leads at +23.713 net rating delta over 2570.89 minutes) and 350 in a partial 2025-26 slice (Victor Wembanyama leads at +17.043 over 2489.02 minutes; Jokic ranks second there). ctx_lineup_proxy.json publishes a Wald 95 percent interval on 408 players' active-versus-missed win-rate delta (mean 0.0087, range -0.6047 to +0.4543); several of its narrowest intervals belong to players whose win rate over their handful of missed games sat exactly at a 0-or-1 boundary, a known degeneracy of the Wald formula rather than genuine precision. rim_deterrence.json shows Wembanyama and Rudy Gobert both appearing in its 2024-25 and 2025-26 top-15 lists, but at different ranks each season. None of the four was fit to, or scored against, a future game; all four are backward-looking, roster-confounded descriptions of games already played.
1 Question
A published lineup-synergy residual, an individual on/off net-rating leaderboard and a team active/missed win-rate proxy are three of the most direct ways a box-score-and-play-by-play corpus can describe a group of NBA players sharing the floor. A fourth artifact, rim-deterrence on/off, applies the identical on-minus-off arithmetic to a defensive process (the opponent's share of shots at the rim) instead of scoring margin, and serves here as a cross-check on how much a leaderboard built this way moves between two season slices. This paper asks three narrow questions: what does a five-man synergy residual describe, what does an individual on/off delta describe, and what does an active-versus-missed win-rate gap add on top of an on/off split, and what does it still fail to separate. None of the four was fit to a target and scored out of sample, so none of them is read here as a forecast of a future lineup, player, or game; the question is only whether the published numbers, and their published denominators, are being read correctly.
2 Data and definitions
Four published artifacts back this paper, all built from NBA box-score and play-by-play data, not the MLB in-game tick corpus that this project's MLB quarantine note covers; that quarantine does not apply here. lineup_synergy.json cites two stint-level cache parquets in its receipt (lineup_synergy_2024_25.parquet, on_off_2024_25.parquet), covering only 2024-25. on_off_showcase.json cites a stint-level attribution store whose own caveats describe a 1230-game 2024_25 play-by-play corpus plus a companion 196-game 2025_26 slice. ctx_lineup_proxy.json cites a game-log table (source_artifact: data/cache/cv_fix/leaguegamelog_regular_season.parquet), box-score-level, as of the 2025-26 regular season through 2026-04-12. rim_deterrence.json cites two zone shot-mix cache parquets, a play-by-play-derived shot-location attribution over 2024-25 and 2025-26.
Coverage differs sharply across the four. lineup_synergy carries 102 qualifying five-man units for 2024-25, and its min_floor_note states on-court minutes range from 101.6 to 940.0, flagging the low end as a small sample. on_off_showcase ranks 353 players in 2024-25 (653 considered, 300 excluded below a 500-on-minute/300-off-minute/30-game floor) and 350 in a partial 2025-26 slice (686 considered, 336 excluded). ctx_lineup_proxy qualifies 408 players against a floor of 15 active and 5 missed games inside each player's own tenure window. rim_deterrence qualifies 370 players in 2025-26 and 387 in 2024-25 against a 500-on-court-minute floor. None of the four denominators is a possession count: three report on-court minutes, ctx_lineup_proxy reports games.
3 Method
lineup_synergy asks a five-player version of the same question: for every five-man unit whose members all individually qualify for on/off, it compares the unit's observed net_per48 to an expected_net_per48 built by summing the five members' individual on/off deltas, then reports synergy_residual = net_per48 - expected_net_per48. A positive residual means the unit's observed result exceeds what an additive combination of its members' individual on/off numbers predicted; a negative residual means it falls short. The residual compares one noisy team-level estimate against a second estimate built from five other noisy individual numbers, not against a fixed, error-free baseline.
synergy_residual = net_per48 - expected_net_per48
ctx_lineup_proxy asks a coarser, team-record question inside a player's own tenure window: delta_win_rate = win_rate_active - win_rate_missed, the team's win rate in games that player did and did not appear in. Each delta carries a Wald 95 percent interval; ci95_offset is the symmetric plus-or-minus half-width published around it. This proxy needs no on-court tracking, but it substitutes a team-record association (who was in the box score) for the minute-by-minute association that on/off net rating measures.
rim_deterrence applies the same on-minus-off arithmetic to a defensive process instead: delta = rim_share_allowed_on - rim_share_allowed_off, the opponent's share of rim attempts with a player on the court minus off. It is included as an independent instance of the same on/off machinery, over a different outcome and a different pair of season slices, to see how much a leaderboard built this way moves.
4 Results
Table 1 lists the eight highest lineup_synergy residuals among the 102 qualifying 2024-25 units, from the artifact's top array. The Memphis five named in the artifact's own headline field (Jaren Jackson Jr., Ja Morant, Desmond Bane, Zach Edey, Jaylen Wells) leads at +24.32 net per 48 across 25 games and 221.8 minutes.
| Rank | Members (5) | Games (n) | Minutes | Net/48 | Expected net/48 | Synergy residual |
|---|---|---|---|---|---|---|
| 1 | Jackson Jr./Morant/Bane/Edey/Wells | 25 | 221.8 | 29.87 | 5.55 | +24.32 |
| 2 | Westbrook/Gordon/Jokic/Porter Jr./Braun | 24 | 128.4 | 27.3 | 6.62 | +20.67 |
| 3 | Conley/Gobert/Reid/Edwards/McDaniels | 26 | 114.1 | 26.08 | 5.8 | +20.29 |
| 4 | Irving/Thompson/Washington/Doncic/Lively II | 14 | 118.7 | 23.45 | 4.17 | +19.28 |
| 5 | Schroder/Finney-Smith/Claxton/Johnson/Thomas | 9 | 105.8 | 14.51 | -3.8 | +18.32 |
| 6 | Conley/Gobert/DiVincenzo/Alexander-Walker/Reid | 29 | 123.0 | 24.59 | 6.43 | +18.16 |
| 7 | Lopez/Lillard/Portis/Trent Jr./Green | 16 | 121.1 | 21.0 | 3.04 | +17.97 |
| 8 | James/Finney-Smith/Doncic/Hachimura/Reaves | 13 | 107.8 | 22.7 | 5.16 | +17.55 |
Source: lineup_synergy.json, top array, ranks 1-8 of 102 qualifying 2024-25 units.
The single most negative published residual belongs to a Portland five (Jerami Grant, Anfernee Simons, Deandre Ayton, Shaedon Sharpe, Toumani Camara): an observed -30.86 net per 48 against an expected -4.59, a residual of -26.27 over 13 games and 136.9 minutes. Both extremes sit closer to the low end of the 101.6-to-940.0-minute range than the high end, which is what the min_floor_note warns against over-reading. lineup_synergy is a single 2024-25 slice, and its own confounds field calls this a descriptive association, not proof of a five-man chemistry effect.
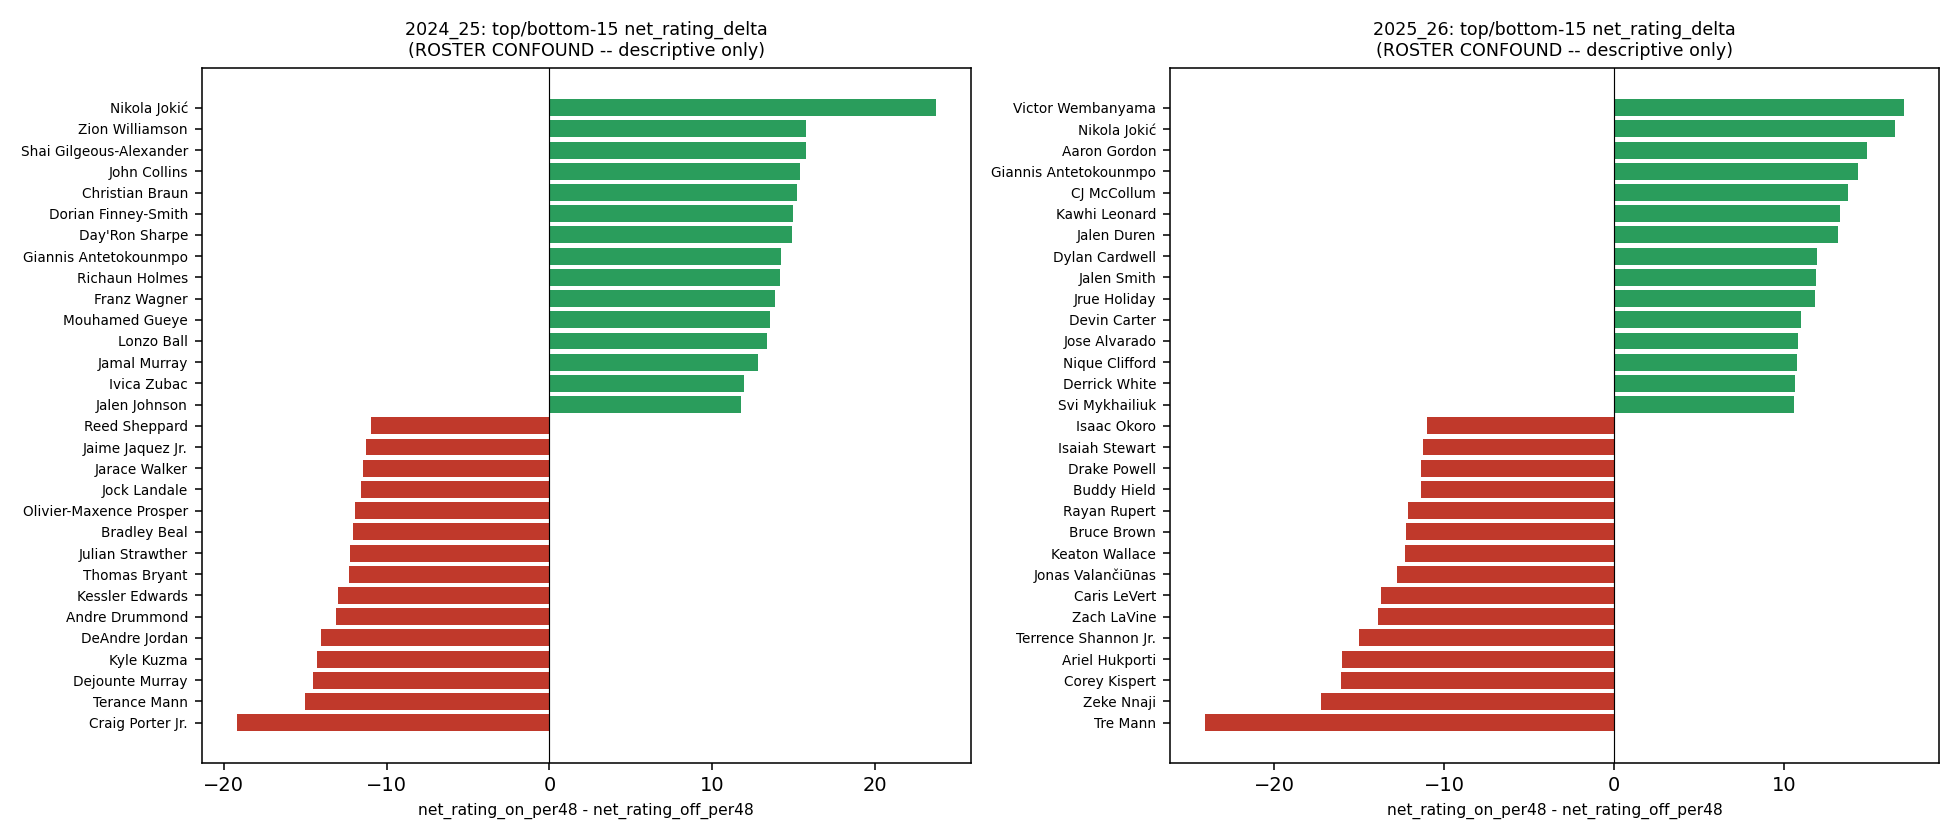
Published on/off net-rating leaderboard: per-season distributions and the top and bottom ranked players, 2024-25 and 2025-26.
The leaderboard behind that figure separates cleanly by season. In 2024-25 (1230 games), Nikola Jokic tops 353 ranked players at +23.713 net rating delta over 2570.89 minutes; the distribution's median is +0.195, range -19.206 to +23.713. In a partial 2025-26 slice (196 games), Victor Wembanyama tops 350 ranked players at +17.043 over 2489.02 minutes, median +0.127, range -24.09 to +17.043; Jokic ranks second there at +16.504 over 2118.92 minutes. Both seasons carry the same caveat: this delta is not a causal player-impact estimate, because who shares the floor with a player is entangled with coach trust, opponent strength and garbage-time usage, none of which is controlled for.
ctx_lineup_proxy publishes a Wald 95 percent interval on every one of its 408 players' delta_win_rate; Table 2 lines up the four widest against the four narrowest.
| Player | Team | Active (n) | Missed (n) | Win rate active | Win rate missed | Delta win rate | 95% half-width |
|---|---|---|---|---|---|---|---|
| Isaiah Jackson | LAC | 17 | 5 | 0.6471 | 0.4 | +0.2471 | 0.4858 |
| Moritz Wagner | ORL | 36 | 5 | 0.5833 | 0.4 | +0.1833 | 0.4586 |
| Walter Clayton Jr. | UTA | 45 | 5 | 0.2889 | 0.4 | -0.1111 | 0.4494 |
| Micah Potter | IND | 47 | 5 | 0.234 | 0.4 | -0.166 | 0.4461 |
| Harrison Barnes | SAS | 77 | 5 | 0.7403 | 1.0 | -0.2597 | 0.0979 |
| Naji Marshall | DAL | 74 | 5 | 0.3378 | 0.0 | +0.3378 | 0.1078 |
| Leaky Black | WAS | 15 | 10 | 0.0667 | 0.0 | +0.0667 | 0.1262 |
| Ivica Zubac | LAC | 43 | 6 | 0.3953 | 1.0 | -0.6047 | 0.1461 |
Source: ctx_lineup_proxy.json, players array, ci95_offset (half-width shown; the published interval is symmetric).
The pattern is not simply more games producing a narrower interval. Harrison Barnes and Naji Marshall both qualify on exactly 5 missed games, the artifact's own floor, yet post two of the four narrowest published intervals, at plus-or-minus 0.0979 and 0.1078. The reason sits in the same row: Barnes's win_rate_missed is exactly 1.0 and Marshall's is exactly 0.0, both a proportion boundary. The standard Wald variance term is proportional to p times (1 minus p), so a proportion of exactly 0 or 1 drives that term toward zero regardless of sample size, producing a tight interval on a small, boundary-sitting sample rather than a reliable one. The four widest intervals (Isaiah Jackson, Moritz Wagner, Walter Clayton Jr., Micah Potter) all sit at an interior win_rate_missed of 0.4, with 17 to 47 active games behind them; their intervals are wide because the proportion is nowhere near a boundary. Reading a narrow interval as reliable, without checking where win_rate_missed sits, is a mistake this dataset makes easy to fall into.
Table 3 places rim_deterrence's two season slices side by side for the two players who lead at least one.
| Player | Season | On-court minutes | Rim share allowed (on) | Rim share allowed (off) | Delta |
|---|---|---|---|---|---|
| Victor Wembanyama | 2025-26 | 2489.0 | 0.25 | 0.3118 | -0.0618 |
| Victor Wembanyama | 2024-25 | 1527.2 | 0.2734 | 0.3275 | -0.0541 |
| Rudy Gobert | 2024-25 | 2388.5 | 0.2785 | 0.3417 | -0.0632 |
| Rudy Gobert | 2025-26 | 2357.3 | 0.3047 | 0.3485 | -0.0438 |
Source: rim_deterrence.json, seasons[].leaders array, both published season slices.
Wembanyama moves from fourth in 2024-25 to first in 2025-26; Gobert moves from first in 2024-25 to ninth in 2025-26. Both appear in both published top-15 lists, some evidence the association is not pure noise, but neither holds the same rank, and several 2024-25 leaders (Zach Collins, Bogdan Bogdanovic, Joel Embiid, Jaylin Williams, Quinten Post, Georges Niang) do not appear in the published 2025-26 top 15 at all. A single season's on/off rank, on either metric, moves.
5 Robustness and what would falsify this
- Cross-season rank movement is a real falsification test, not just noise: if a lineup residual or an on/off delta were driven purely by random season-to-season variation, a player or lineup at one extreme would be no more likely than any other to reappear near the same extreme next time. Wembanyama and Gobert both landing in both published rim_deterrence top-15 lists, and Jokic anchoring both on_off_showcase top-2 lists, is a small amount of evidence against pure noise; the size of the movement inside that persistence (first to ninth for Gobert) shows how much of a single-season leaderboard position is still season-specific.
- The Wald-interval degeneracy above would falsify itself the moment a non-Wald interval (a Wilson or exact binomial interval) was published for the same boundary-proportion players: if a recomputed interval for Harrison Barnes or Naji Marshall came back close to the same width, the boundary effect described here would not hold up. The published Wald formula, applied at a proportion of exactly 0 or 1, is what produces it.
- lineup_synergy's residual compounds two noisy numbers rather than comparing against a fixed target: the expected baseline is itself a sum of five individual on/off deltas, each subject to the same roster confound as on_off_showcase's leaderboard. A unit's residual moving after a full second season of that group's minutes were added would show whether the residual is closer to a real property of the grouping or an artifact of the current roughly 100-to-900-minute sample.
- None of the four measurements adjusts for opponent strength, so a residual, delta, or win-rate gap can move because of who a group played, not only who shared the floor.
6 Limitations
- On/off splits (net rating delta and rim-deterrence delta alike) bundle teammates, opponent strength and garbage-time minutes into a single on-minus-off number; on_off_showcase's own caveat names coach trust, opponent strength and garbage-time usage as specific uncontrolled factors, and none of the four artifacts here separates them out.
- Lineup selection is itself part of what gets measured: which five-man unit a coach fields, for how many minutes, against which opponent and in which game state, is a coaching choice, not a random assignment, so an observed unit's minutes are not a sample of that unit against an average schedule.
- The active/missed proxy substitutes a different, still-confounded question for on/off: ctx_lineup_proxy's own confound field states that why a player missed games is entangled with injury clustering, rest-day scheduling and blowout-driven absences, each pairing the same missed bucket with a different replacement lineup; the published delta cannot separate a multi-week injury from a single rest day or a permanent roster change.
- Small-sample lineup residuals need heavy shrinkage that the published numbers do not apply: lineup_synergy's 102 qualifying units range from 101.6 to 940.0 on-court minutes, its own min_floor_note warns against over-reading the low end, and no regularization toward zero or toward a league mean is applied to the published synergy_residual before it is ranked.
- A published Wald interval can be narrowest exactly where the underlying proportion sits at a 0-or-1 boundary from a handful of games, which is a property of the interval formula, not evidence that the estimate is unusually precise.
- All four measurements are backward-looking descriptions of games already played; none was fit to, or scored against, a future game, and lineup_synergy in particular has only one season (2024-25) of qualifying units, with no second-season replication yet possible.
7 How to read this on the site
The module pages for lineup_synergy, on_off_showcase, ctx_lineup_proxy and rim_deterrence each publish their full top and bottom lists, qualifying floors and confound notes behind Tables 1 through 3; read the floor and confound note on each page before its ranked numbers, since the four apply different qualifying bars to different slices of the same box-score and play-by-play corpus. The related analyses apply these same fields through a per-player on/off lens, an active-missed record lens, a lineup-residual-reversal lens, and a two-axis rim-pressure lens; each is a different arithmetic view of the numbers cited here, not a new measurement. The cross-sport comparability inspector is the relevant published gate for anyone comparing these NBA-only numbers against another sport's.
Evidence
- lineup_synergy.jsonas_of 2026-07-25T04:25:58.801043+00:00Source path: /analytics/m/lineup_synergy/
Evidence field inventory (21 paths)
- headline
- method
- metric_definition
- season
- n_qualified
- min_floor_note
- top[].rank
- top[].members
- top[].n_games
- top[].min
- top[].net_per48
- top[].expected_net_per48
- top[].synergy_residual
- bottom[].members
- bottom[].n_games
- bottom[].min
- bottom[].net_per48
- bottom[].expected_net_per48
- bottom[].synergy_residual
- confounds
- receipt.source_parquets
- on_off_showcase.jsondate not publishedSource path: /analytics/m/on_off_showcase/
Evidence field inventory (25 paths)
- caveat
- metric
- seasons.2024_25.question
- seasons.2024_25.min_sample.min_on
- seasons.2024_25.min_sample.min_off
- seasons.2024_25.min_sample.n_games
- seasons.2024_25.n_considered
- seasons.2024_25.n_excluded_below_floor
- seasons.2024_25.n_ranked
- seasons.2024_25.distribution.median
- seasons.2024_25.distribution.min
- seasons.2024_25.distribution.max
- seasons.2024_25.top_15[].player_name
- seasons.2024_25.top_15[].net_rating_delta
- seasons.2024_25.top_15[].min_on
- seasons.2025_26.question
- seasons.2025_26.n_considered
- seasons.2025_26.n_excluded_below_floor
- seasons.2025_26.n_ranked
- seasons.2025_26.distribution.median
- seasons.2025_26.distribution.min
- seasons.2025_26.distribution.max
- seasons.2025_26.top_15[].player_name
- seasons.2025_26.top_15[].net_rating_delta
- seasons.2025_26.top_15[].min_on
- ctx_lineup_proxy.jsonas_of 2025-26 regular season (through 2026-04-12)Source path: /analytics/m/ctx_lineup_proxy/
Evidence field inventory (23 paths)
- method
- source_artifact
- as_of
- floors.min_missed
- floors.min_active
- confound
- n_qualified
- delta_summary.n
- delta_summary.mean
- delta_summary.min
- delta_summary.max
- top_help[].player_name
- top_help[].delta_win_rate
- top_hurt[].player_name
- top_hurt[].delta_win_rate
- players[].player_name
- players[].team
- players[].n_active
- players[].n_missed
- players[].win_rate_active
- players[].win_rate_missed
- players[].delta_win_rate
- players[].ci95_offset
- rim_deterrence.jsonas_of 2026-07-25T04:12:47.517923+00:00Source path: /analytics/m/rim_deterrence/
Evidence field inventory (11 paths)
- method
- metric_definition
- seasons[].season
- seasons[].n_qualified
- seasons[].min_on_floor
- seasons[].leaders[].player_name
- seasons[].leaders[].min_on
- seasons[].leaders[].rim_share_allowed_on
- seasons[].leaders[].rim_share_allowed_off
- seasons[].leaders[].delta
- confounds