Research paper
Pace, star removal and momentum in the NBA
What a counterfactual simulator says a variance lever is worth, what removing a lead player costs a modeled matchup, and which momentum-shaped claims survived testing
Abstract
This note pulls together three NBA measures: a schedule-legal variance lever, a modeled lineup subtraction, and preregistered momentum tests. The pace-variance simulator fixes a matchup's strength and per-possession variance and varies only the possession count: across the published pace grid (92 to 104, wider than the observed p5-p95 range of 97.0 to 102.2 over 7,340 team-games), a 70 percent reference favorite's modeled win probability moves from 0.6927 at pace 92 to 0.7038 at pace 104, a swing of 0.0111, and an 8,000-run Monte Carlo check reproduces that formula within 0.0042. A separate scenario compares, across 30 teams, Elo-based win probability against a league-average opponent with and without each team's highest on/off player: the widest gap is Denver with Nikola Jokic, 0.634 with him against 0.0517 without, a difference of 0.5822 on 2,570.9 on-court minutes. Separately, seven preregistered momentum, fatigue and clutch-window tests confirmed an effect against an internal baseline (n 1,052 to 8,164), one replicated on a second corpus, while five individual streak-shaped claims -- a back-to-back dip, foul trouble, rest differential -- returned null on samples of 1,798 to 65,103. A companion module refused to build a clutch-window rate because the box score is full-game only; the Q4-versus-Q1-Q3 per-36 shift (409 of 626 qualified) is published as a labeled non-clutch substitute. None of the three measures forecasts a game: the simulator states its own assumptions, the removal scenario compares against a fixed floor, and a null result here is a finding, not a gap.
1 Question
This note asks three questions: how much a variance lever such as game pace can move a favorite's modeled win probability, what a modeled star-removal comparison implies about a lead player's contribution, and which momentum-shaped claims about NBA games survive a preregistered test rather than an after-the-fact one.
All three draw on the project's showcase artifacts, built from NBA box scores, play-by-play windows, lineup stints and the possession-level simulator: cf_pace_variance.json, cf_star_removal.json, nba_momentum_tested.json, nba_q4_shift.json and clutch_context.json. Every path or corpus tag cited below sits under domains/basketball_nba or an NBA box-score, play-by-play or lineup-stint corpus tag; none touches the MLB in-game tick corpus the project's MLB quarantine governs, so that quarantine does not apply here.
2 Data and definitions
cf_pace_variance.json (as_of 2026-07-23) is built from data/domains/basketball_nba/asof_team_adv.parquet and game_finals_corrected.parquet. Its data_params record a reference pace of 99.77 team possessions (rounded to 99.8 in the curve grid), an observed pace standard deviation of 1.72 across 7,340 team-games, and a p5-p95 range of 97.0 to 102.2. A margin_std of 15.89 over 3,616 games anchors the per-possession variance parameter; the artifact flags that anchor as an upper bound, since it also carries matchup dispersion, and states it cancels out of the headline formula regardless.
cf_star_removal.json (as_of 2024-25 (Elo end-of-season) x 2024_25 on/off slice) is built from data/models/elo_state.json and a lineup-context claims cache, covering 30 teams. Its method compares each team's Elo rating, with and without its highest-delta on/off player, against a fixed reference_opponent_elo of 1500.0 on a neutral site; the elo_per_netrating_point conversion of 25.3333 is a frozen constant anchored to the repo's own home-court Elo advantage (elo_config.ELO_HFA of 76 Elo, about 3.0 points), not a value fit to this scenario's own output.
nba_momentum_tested.json (generated_at 2026-07-25T11:13:25) surfaces the project's own preregistered forward-claim scoreboard (scripts/platformkit/analytics_showcase/out/fwd_claim_scoreboard.json) across corpus tags including player_boxscores_2024_25_2025_26, pbp_p1_json_timeout_windows and stints_2023_24+2024_25, plus one claim checked against a named second corpus, replication_wave1_second_corpus.
clutch_context.json (as_of 2026-07-23T03:21:53) is a documented refusal, not a measurement: its input, data/domains/basketball_nba/player_boxscores.parquet, is a full-game aggregate with no period or clutch column, so a late-game rate cannot be computed from it without fabricating the split. The artifact names exactly what a re-ingest would need (a period, clutch or q4_min column) and where the missing grain already lives, in data/cache/quarter_box per-game-per-period files that the current ingest script sums away. nba_q4_shift.json (generated_at 2026-07-24T22:39:47) is the published, honestly labeled alternative: a Q4-versus-Q1-Q3 per-36 descriptive shift, not a clutch metric, over 1,231 cached games from the 2024-25 and 2025-26 seasons (a fixed historical set, not the current season), with a floor of at least 25 Q4 games and 100 combined Q1-Q3 minutes; 409 of 626 considered players qualified.
3 Method
The pace mechanism follows from how a game's total scoring margin accumulates. Holding a matchup's per-possession scoring differential and variance fixed, the margin's average grows in proportion to the number of possessions N, while its standard deviation grows only in proportion to the square root of N. The standardized margin -- what a Normal-approximation win-probability model actually uses -- therefore scales with the square root of N once the matchup's strength is pinned at a reference pace. Pace does not change either team's per-possession rate or variance, held pace-invariant by construction; it changes only how many chances that fixed rate gets to outrun the noise.
upset_prob(N) = 1 - Phi( Phi^-1(p_fav_at_N_ref) * sqrt(N / N_ref) )
The star-removal scenario computes star_elo_removed as on_off_net_rating_delta times the 25.3333 conversion constant, subtracts it from the team's Elo rating, and recomputes a win probability against the fixed 1500 neutral-site opponent on the repo's logistic rating curve. What it assumes about replacement minutes is in its own caveat: the without side is not a modeled replacement player, it is the observed net rating of whatever lineup the team used while that player was off the floor -- backups, small-ball units and blowout garbage time, not a controlled substitution. The source flags that the linear Elo subtraction, against a nonlinear logistic curve, gives the same on/off delta a larger probability swing for a mid-strength team than a very strong or weak one; on/off deltas are pre-floored at 500 on-court minutes and 30 games.
Each momentum-scoreboard row is one of the project's own preregistered tests, run before the corpus was inspected for that specific shape, and its verdict is a leak-free effect or accuracy finding measured against an internal statistical baseline on the named corpus, not a claim about any practical value beyond that test. CONFIRMED_LOCAL means the effect cleared that baseline on one corpus; REPLICATED means a second, independently named corpus reproduced the same direction; NULL_LOCAL means the tested shape carried no measurable signal past the baseline on that corpus -- a result, not an absence of a result.
4 Results
The pace-variance curve for a team modeled as a 70 percent favorite at the reference pace of 99.8 shows the expected square-root-of-N pattern: slower paces (fewer possessions) pull the favorite's modeled win probability down toward the coin flip, faster paces push it further from it.
| Pace (team possessions) | Favorite win probability | Change from baseline (pp) |
|---|---|---|
| 92.0 | 0.6927 | -0.0073 |
| 94.0 | 0.6946 | -0.0054 |
| 96.0 | 0.6965 | -0.0035 |
| 98.0 | 0.6984 | -0.0016 |
| 99.8 (reference) | 0.7000 | 0.0000 |
| 100.0 | 0.7002 | +0.0002 |
| 102.0 | 0.7020 | +0.0020 |
| 104.0 | 0.7038 | +0.0038 |
Source: cf_pace_variance.json, curves[] at fav_strength_at_ref_pace=0.7, by_pace[]. Change from baseline is each row's fav_win_prob minus the reference-pace row's fav_win_prob (both published fields).
The grid spans pace 92 to 104, wider than the observed p5-p95 range of 97.0 to 102.2; restricted to that range the swing is smaller than the endpoints show. The pattern holds at the other two published reference strengths: a 60 percent favorite's upset probability swings by 0.0059 across the grid and an 80 percent favorite's by 0.0144 -- larger for the more lopsided matchup, since the same square-root-of-N scaling acts on a larger starting standardized margin.
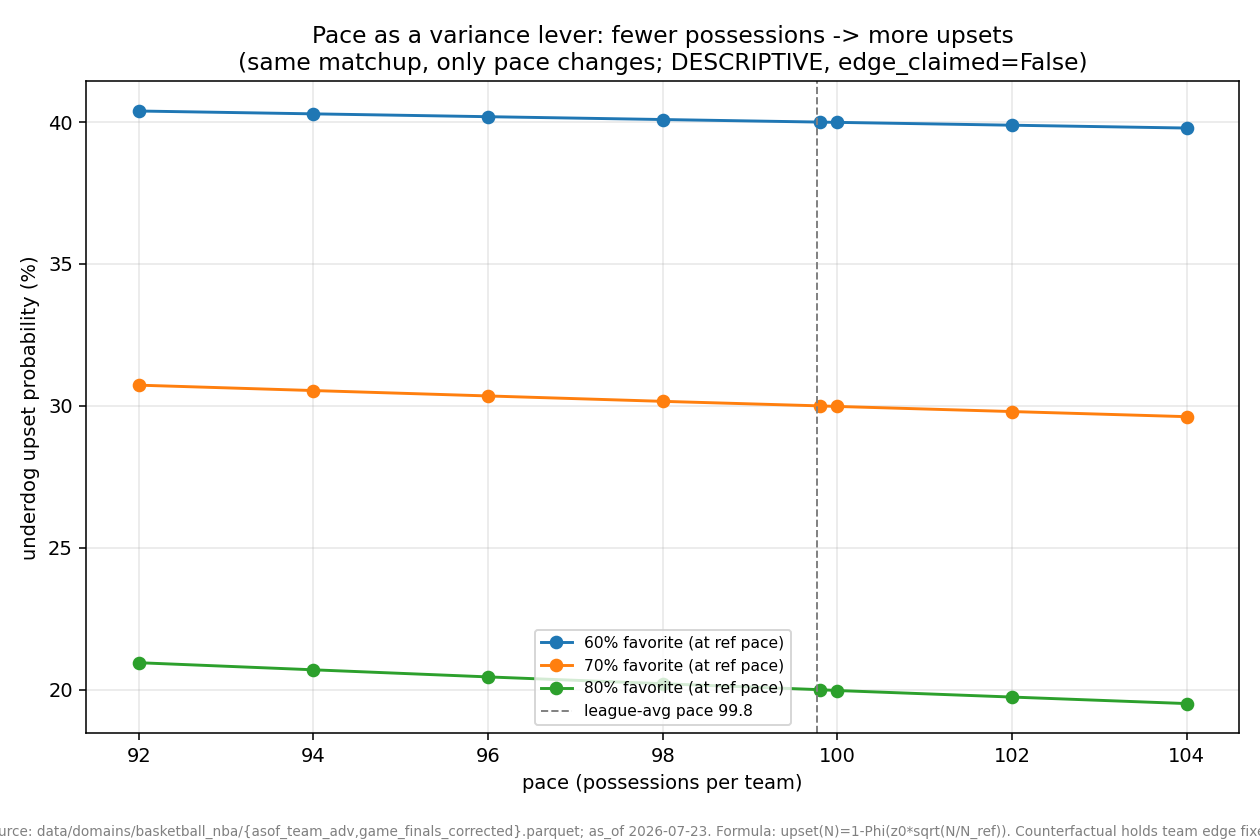
Published favorite win-probability curves across the pace grid, for reference favorites of 60, 70 and 80 percent.
For the star-removal scenario, the ten highest published win-probability gaps of the 30-team distribution bracket the range.
| Team (player) | Win probability with player | Win probability without player | Difference (with minus without) | Minutes with player on court (n) |
|---|---|---|---|---|
| DEN (Nikola Jokic) | 0.634 | 0.0517 | 0.5822 | 2570.9 |
| OKC (Shai Gilgeous-Alexander) | 0.7829 | 0.2658 | 0.5171 | 2597.7 |
| LAL (Dorian Finney-Smith) | 0.6232 | 0.1576 | 0.4656 | 1241.6 |
| MIL (Giannis Antetokounmpo) | 0.6059 | 0.1617 | 0.4441 | 2288.7 |
| LAC (Ivica Zubac) | 0.6501 | 0.2451 | 0.4051 | 2624.4 |
| IND (Pascal Siakam) | 0.6291 | 0.2419 | 0.3872 | 2547.8 |
| ORL (Franz Wagner) | 0.4978 | 0.1162 | 0.3816 | 2023.3 |
| CHI (Lonzo Ball) | 0.5006 | 0.1248 | 0.3758 | 777.0 |
| ATL (Mouhamed Gueye) | 0.4801 | 0.1133 | 0.3668 | 532.8 |
| CLE (Isaac Okoro) | 0.7115 | 0.4085 | 0.303 | 1053.1 |
Source: cf_star_removal.json, teams[]. Minutes with player on court is the published support measure (min_on), not a game count; the scenario's own caveat states it does not control for teammates, opponent, coaching trust or garbage time.
Across all 30 teams the gap ranges from Denver's 0.5822 down to 0.1371 for Philadelphia (Guerschon Yabusele); minutes among the ten shown range from 777.0 (Chicago, Lonzo Ball) to 2,624.4 (LA Clippers, Ivica Zubac), so the largest gaps are not simply the players who played the most.
The momentum scoreboard's own preregistered verdicts split cleanly: structural, schedule- and role-shaped effects hold up, and the individual game-to-game carryover shapes do not.
| Claim | Verdict | n | Effect (artifact units) | What the effect describes |
|---|---|---|---|---|
| b2b_rest_penalty | CONFIRMED_LOCAL | 7192 | -1.955 | Back-to-back drag on scoring output |
| three_in_four_fatigue | CONFIRMED_LOCAL | 7222 | -1.213 | Added fatigue drag on 3-in-4 nights |
| clutch_lineup_shortening | CONFIRMED_LOCAL | 1052 | -6.3384 | Rotation shortens in clutch minutes |
| clutch_usage_compression | CONFIRMED_LOCAL | 8164 | 0.5031 | Usage concentrates onto fewer players |
| timeout_interrupts_opponent_run__h1 | CONFIRMED_LOCAL | 1357 | -0.7314 | A timeout interrupts an opponent scoring run |
| timeout_interrupts_opponent_run_replication_2022_23 | REPLICATED | 2544 | not published | Same timeout effect on a second corpus |
| lineup_continuity_streak_vs_point_diff__2024-25 | CONFIRMED_LOCAL | 2460 | 0.0788 | Lineup continuity relates to point differential |
| player_b2b_scoring_dip | NULL_LOCAL | 65103 | -0.0053 | A player's own back-to-back scoring dip |
| rest_differential_margin__h1 | NULL_LOCAL | 1798 | -0.018 | Rest-day differential margin effect |
| foul_trouble_efficiency_shift__h1 | NULL_LOCAL | 5972 | -0.09861 | Foul trouble scoring-efficiency shift |
| foul_trouble_usage_shift__h1 | NULL_LOCAL | 5972 | 0.00712 | Foul trouble usage-rate shift |
| b2b_x_margin_starter_minutes__h1 | NULL_LOCAL | 3596 | -0.0372 | Back-to-back times margin effect on starter minutes |
Source: nba_momentum_tested.json, groups[].claims[]. No unit is published per effect; the description column paraphrases each claim's own reading field. The replication claim's effect is not published (null in the source).
The single replicated claim, that a timeout interrupts an opponent's scoring run, is the only one of the seven confirmed claims checked against a second, independently named corpus (2,544 games, replication_wave1_second_corpus); the other six stand on one corpus tag each. All five null claims are individual-player or individual-game carryover shapes tested on samples from 1,798 to 65,103.
The Q4-versus-Q1-Q3 per-36 shift, published because clutch_context.json's refusal ruled out a real clutch number, moves both directions: among 409 qualified of 626 considered players, Sandro Mamukelashvili rises from 15.74 to 29.26 points per 36 in Q4 (a shift of 13.52 over 52 Q4 games), while Domantas Sabonis falls from 21.93 to 14.39 (-7.54 over 57 Q4 games). The source is explicit this is a lineup- and blowout-dependent split, not a ranking of clutch ability.
5 Robustness and what would falsify this
An 8,000-run Monte Carlo simulation, drawing points per possession from a declared 0/2/3 shot-value distribution (48.7/39.4/12.0 percent), reproduces the closed-form 70 percent reference case within 0.0042 (simulated favorite win rate 0.6957 against the formula's 0.7); that is an internal consistency check between the closed-form formula and a possession-by-possession simulation, not an external validation against real games.
The momentum scoreboard's own discipline requires an independent second corpus before a finding counts as more than single-corpus; only the timeout-run claim clears that bar (2,544 games, replication_wave1_second_corpus). The other six CONFIRMED_LOCAL claims, including both fatigue and both clutch-rotation effects, are single-corpus findings until a second corpus is run.
What would change this: a nonlinear, team-strength-conditioned conversion in place of the linear Elo subtraction would be expected to compress or widen the published gaps for mid-strength teams, falsifying the current ranking if it moved materially. A re-ingest of data/cache/quarter_box keeping the period column, rather than summing it away, would let a real clutch-window rate be computed directly, confirming or contradicting the Q4 shift as a stand-in. A second independent corpus for any unreplicated CONFIRMED_LOCAL claim that failed to reproduce the same sign would overturn that claim alone.
6 Limitations
Two kinds of limit apply here: what the pace and star-removal simulators can establish given their own stated assumptions, and what the momentum and Q4 measurements can establish given what was actually observed.
Simulator assumptions (pace variance and star removal):
- The pace-variance win probabilities are the closed-form output of a Normal-margin model that holds each matchup's per-possession scoring rate and variance pace-invariant by construction; they show what that model's own assumptions imply about a square-root-of-N scaling, not a causal estimate of what happens when a real team plays faster or slower.
- The star-removal scenario compares every team to the same fixed 1500 neutral-site opponent rather than a real matchup, and subtracts the star's Elo linearly despite the underlying win-probability curve being a nonlinear logistic, which the source itself flags as inflating the swing for some team strengths relative to others.
- Star removal's without side is the team's own observed net rating while that player was off the floor, not a modeled replacement player; it is a full-lineup swing that is not adjusted for which teammates, opponents, or game states happened to make up those off-court minutes.
Observed-data limits (momentum and the Q4 shift):
- Six of the seven CONFIRMED_LOCAL momentum-shaped effects, including both fatigue findings, are single-corpus results; only the timeout-interrupts-a-run effect has an independent second-corpus replication recorded.
- clutch_context.json is a refusal, not a null result: the box score behind it carries no period or clutch grain at all, so no clutch rate, confirmed, null, or otherwise, could be computed from it.
- The Q4-versus-Q1-Q3 per-36 shift is a descriptive split on a fixed, already-cached set of 1,231 games from two seasons, not the current season, and is not adjusted for lineup, score state, or blowout garbage time; the source is explicit that it is not a clutch metric and not predictive.
7 How to read this on the site
The published figure for cf_pace_variance sits on its own module page alongside the pace-variance-favorite-probability analysis, which exposes every published pace-strength cell; the star-removal-team-win-probability analysis exposes the same 30-team scenario behind the table above, with its own caveat about roster confounding restated inline. The nba-q4-role-redistribution analysis scales the published Q4 per-36 changes by each player's own earlier-quarter rate, and the nba-team-profile-pace-fragility-fatigue-halftime analysis is the place to read pace alongside fourth-quarter fragility and fatigue at the team-profile level rather than the matchup level used here.
For whether an NBA number here could ever be compared against a similarly labeled MLB or soccer number elsewhere on the site, see the cross-sport-comparability inspector, the only published inspector whose scope includes the NBA. For how schedule and roster availability behave as separate, pre-tip-off conditioning variables in the NBA -- related but different from the scenarios here -- see the nba-rest-asymmetry and rest-load-and-outcomes-nba papers.
Evidence
- cf_pace_variance.jsonas_of 2026-07-23Source path: /analytics/m/cf_pace_variance/
Evidence field inventory (27 paths)
- label
- as_of
- source_artifact
- method
- formula
- data_params.pace_std
- data_params.pace_p5
- data_params.pace_p95
- data_params.pace_n
- data_params.margin_std
- data_params.margin_n
- data_params.v_pp_anchor
- reference_pace_N_ref
- curves[].fav_strength_at_ref_pace
- curves[].upset_prob_at_ref_pace
- curves[].by_pace[].pace
- curves[].by_pace[].is_ref_pace
- curves[].by_pace[].fav_win_prob
- curves[].by_pace[].upset_prob
- curves[].upset_swing_slow_minus_fast
- assumptions[]
- mc_validation.n_sim
- mc_validation.declared_ppp_dist
- mc_validation.mc_fav_win_rate
- mc_validation.formula_fav_win_prob
- mc_validation.abs_diff
- verdict
- cf_star_removal.jsonas_of 2024-25 (Elo end-of-season) x 2024_25 on/off sliceSource path: /analytics/m/cf_star_removal/
Evidence field inventory (17 paths)
- question
- as_of
- source_artifacts[]
- n_teams
- method.elo_per_netrating_point
- method.elo_per_netrating_point_anchor
- method.reference_opponent_elo
- method.site
- assumptions_and_floors[]
- caveat
- teams[].team_abbr
- teams[].player_name
- teams[].p_win_with
- teams[].p_win_without
- teams[].delta_winprob
- teams[].min_on
- teams[].on_off_net_rating_delta
- clutch_context.jsonas_of 2026-07-23T03:21:53.803282+00:00Source path: /analytics/m/clutch_context/
Evidence field inventory (12 paths)
- status
- reason
- input
- fields_present[]
- fields_needed.grain_discriminator_any_of[]
- fields_needed.explanation
- where_the_grain_actually_lives.raw_cache
- where_the_grain_actually_lives.why_absent_downstream
- declared_floors_when_buildable.min_late_minutes_total
- declared_floors_when_buildable.min_qualifying_games
- story
- as_of
- nba_momentum_tested.jsonas_of 2026-07-25T11:13:25.348914+00:00Source path: /analytics/m/nba_momentum_tested/
Evidence field inventory (14 paths)
- headline
- method
- generated_at
- source_artifact
- groups[].key
- groups[].title
- groups[].summary
- groups[].claims[].hypothesis
- groups[].claims[].verdict
- groups[].claims[].n
- groups[].claims[].effect
- groups[].claims[].corpus
- groups[].claims[].reading
- confounds[]
- nba_q4_shift.jsonas_of 2026-07-24T22:39:47.027837+00:00Source path: /analytics/m/nba_q4_shift/
Evidence field inventory (17 paths)
- headline
- method
- un_refusal_note
- refusal_artifact
- observation_window.n_games
- observation_window.seasons
- floors
- n_considered
- n_qualified
- generated_at
- confounds[]
- pts_shift.top_risers[].player_name
- pts_shift.top_risers[].shift
- pts_shift.top_risers[].q4_games
- pts_shift.top_fallers[].player_name
- pts_shift.top_fallers[].shift
- pts_shift.top_fallers[].q4_games