Research paper
Rest, load and outcomes
The schedule-fatigue tax and the load-bearing index in the NBA, with their observation windows kept separate
Abstract
This note describes two separate NBA descriptive measures and keeps their observation windows apart rather than blending them into one story. The Schedule Fatigue Tax (SFT) multiplies each of 90 team-seasons' own back-to-back frequency (2023-24 through 2025-26) by a single leaguewide anchor effect, -1.73 points per 100 team offensive rating (rested minus back-to-back, n=4732 player-games, p=0.0056), or by a raw per-36 box-composite penalty of -0.315 (n=12000 back-to-back player-games versus 40157 rested player-games). Because the anchor is a constant multiplied through every team, the resulting ranking mirrors each team's own back-to-back exposure (0.156 to 0.218 games per season) rather than a team-specific fatigue effect. The Load-Bearing Index (LBI) separately asks how much each of 30 teams' win outcomes concentrate on one player, using two independent estimators drawn from different seasons: an Elo on/off comparison for 2024-25 and a raw active-versus-missed win-rate comparison for 2025-26 (through 2026-04-12). The two estimators name the same most-load-bearing player for only 1 of 30 teams (3.33 percent), reported here as directional corroboration, not a paired estimate. Both measures are conditioning variables known before tip-off -- the schedule is fixed once released, and player availability is known before the game starts -- described here at the team-season and team level. Neither measure establishes a causal effect, the SFT team-season table is not itself significance-tested, and roster changes, opponent strength and lineup context are uncontrolled in both.
1 Question
This note asks two separate descriptive questions about a common theme: what an NBA team's schedule and its roster availability look like as conditioning variables known before tip-off. First, does the back-to-back load a team carries across a season show up as a measurable production or margin tax, and how is that tax spread across 90 published team-seasons. Second, how concentrated is a team's win outcome on its single most-indispensable player, measured two ways from two one-season windows, and how often do the two name the same player.
Both measures are pre-tip-off conditioning variables. Rest days are fixed once the league schedule is released; which player is or is not available is known, with injury reports, before a game starts. Neither measure is presented here as a forecast, and neither is tested here as a live input to a probability model.
2 Data and definitions
The Schedule Fatigue Tax module (novel_schedule_fatigue_tax.json) reports 90 team-seasons across three NBA seasons, 2023-24 through 2025-26, one row per team-season with its back-to-back game count, back-to-back frequency, and two tax variants. The site manifest's entry for this module carries no as_of date -- date not published -- so the module's own schedule_inequality and per_season_b2b_freq_range fields are the only timing context available beyond the pooled season range.
That module's source_artifacts field points to schedule_density.json, which supplies the underlying per-36 box-composite means by schedule-density state: 12000 back-to-back player-games, 17531 in a 3-in-4 window, 20120 in a 4-in-6 window, and 40157 rested player-games (2 or more days rest, no compression), pooled from 77744 total rows and 7222 team-games across the same three seasons. schedule_density.json's manifest as_of is also not published. Its own methodology states the three density classes overlap -- a back-to-back that closes a cluster is also a 3-in-4 -- so their player-game counts are not additive.
The Schedule Fatigue Tax module's mechanism_receipt field cites a separately tested effect, -1.73 points per 100 team offensive rating (rested minus back-to-back, n=4732, p 0.005645490426098632), and names the validation ledger as its source. The showcase export, mechanism_ledger_export.json, records two b2b_rest_penalty runs rather than one, both verdict CONFIRMED_LOCAL and both carrying the corpus tag player_boxscores_2024_25_2025_26: the n=4732 run just cited, and a second at n=7192 with effect -1.955 and p 0.0001174325580081608. Each run stores its own rested-versus-back-to-back split in an evidence string, and both carry a null as_of, unstamped by the ledger's own run_ts convention.
The Load-Bearing Index module (novel_load_bearing_index.json) reports 30 teams, each with two independently sourced estimators: estimator_a is an Elo on/off win-probability comparison for the 2024-25 season, and estimator_b is a raw win-rate comparison between games a player was active and games that player was missed, for the 2025-26 regular season through 2026-04-12. These two as_of windows (as_of.estimator_a, as_of.estimator_b) are printed inside the module itself and are not the same population; that distinction is kept separate throughout this note.
nba_form_curves.json carries no back-to-back, rest, or schedule field in either its insights or showcase build, so it contributes nothing here. nba_consistency_profiles.json (as_of 2026-04-12) does not condition its coefficient-of-variation numbers on rest either, but its own caveat and not_this fields explicitly flag rest as an uncontrolled variable in that module, consistent with the treatment below.
3 Method
SFT is defined two ways in the source module: SFT_credible = b2b_freq * (-1.73 pts/100 ORtg), using the tested mechanism_receipt anchor, and SFT_descriptive = b2b_freq * (-0.315 composite/36), using the raw pooled per-36 delta from schedule_density.json. Both variants use the same team-season back-to-back frequency as the only team-specific input; the multiplier itself is a single leaguewide constant, not something re-estimated per team. A team's SFT ranking is therefore a rescaling of its own back-to-back frequency, not an independently measured team-specific fatigue effect.
The rest-state margin test behind the -1.73 anchor compares average scoring margin on zero rest days (a back-to-back) against average margin on one or more rest days, within one corpus of player boxscores. It is not a controlled experiment: the schedule-maker chooses which games fall on a back-to-back, and travel, opponent quality and home-away patterns are not held fixed between the two rest states.
LBI is defined as LBI_a = the largest, over a team's roster, of win probability with a given player minus win probability without that player (Elo on/off), and LBI_b = the largest, over a team's roster, of win rate while a given player was active minus win rate while that player was missed (raw record). Agreement is flagged true only when the two estimators name the same player for a team. Because estimator_a draws on 2024-25 and estimator_b draws on 2025-26, a match or mismatch between them is a directional cross-check across two different one-season samples, not a paired measurement of the same games.
4 Results
Two tables below describe rest state at the player-game level; a third ranks team-seasons by SFT; two more rank teams by LBI, one per estimator.
| Measurement run | Rest state | n (games) | Avg scoring margin | p-value |
|---|---|---|---|---|
| Run 1 (total n=4732) | 0 days rest (back-to-back) | 856 | -1.41 | 0.005645 |
| Run 1 (total n=4732) | 1+ days rest | 3876 | +0.32 | 0.005645 |
| Run 2 (total n=7192) | 0 days rest (back-to-back) | 1278 | -1.61 | 0.000117 |
| Run 2 (total n=7192) | 1+ days rest | 5914 | +0.35 | 0.000117 |
mechanism_ledger_export.json (showcase copy), its two by_sport.basketball_nba.mechanisms records named b2b_rest_penalty. Run 1 effect -1.73 pts/100 ORtg, Run 2 effect -1.955, both rested minus back-to-back, both CONFIRMED_LOCAL on the corpus tag player_boxscores_2024_25_2025_26. The p-values are rounded; the ledger records 0.005645490426098632 and 0.0001174325580081608. No confidence interval is published for either run.
| Schedule state | n (player-games) | Per-36 composite | Delta vs rested |
|---|---|---|---|
| Rested (baseline, 2+ days, no compression) | 40157 | 13.905 | 0 (baseline) |
| Back-to-back | 12000 | 13.591 | -0.315 |
| 3-in-4 days | 17531 | 13.688 | -0.217 |
| 4-in-6 days | 20120 | 13.712 | -0.193 |
schedule_density.json, per36_deltas and rested_baseline_per36. Classes overlap and are not additive -- a back-to-back closing a cluster is also a 3-in-4. No CI or p-value is published for these pooled per-36 deltas; the source declares them descriptive-only.
The tested margin effect and the raw per-36 deltas point the same direction: less rest associates with lower measured production or margin. The SFT module converts the tested anchor into a team-season index by multiplying it through each team's own back-to-back frequency.
| Team-season | b2b games | b2b frequency | SFT credible (pts/100 ORtg) | SFT descriptive (composite/36) |
|---|---|---|---|---|
| DEN 2025-26 | 17 | 0.218 | -0.3771 | -0.0687 |
| ATL 2024-25 | 17 | 0.21 | -0.3633 | -0.0662 |
| HOU 2024-25 | 17 | 0.21 | -0.3633 | -0.0662 |
| GSW 2023-24 | 17 | 0.207 | -0.3581 | -0.0652 |
| LAC 2024-25 | 17 | 0.207 | -0.3581 | -0.0652 |
| POR 2024-25 | 13 | 0.159 | -0.2751 | -0.0501 |
| BOS 2025-26 | 13 | 0.159 | -0.2751 | -0.0501 |
| ATL 2025-26 | 12 | 0.158 | -0.2733 | -0.0498 |
| CHI 2025-26 | 12 | 0.158 | -0.2733 | -0.0498 |
| MEM 2025-26 | 12 | 0.156 | -0.2699 | -0.0491 |
novel_schedule_fatigue_tax.json, results[] (top five and bottom five of 90 rows). Range across all 90 team-seasons is 0.1072 pts/100 ORtg (schedule_inequality.sft_credible_range), std 0.0252; back-to-back frequency itself ranges 0.156 to 0.218. The spread in back-to-back frequency across teams within a season widened from 0.048 in 2023-24 to 0.051 in 2024-25 to 0.062 in 2025-26 (per_season_b2b_freq_range). Because the multiplier is a constant, this ranking is equivalent to ranking by back-to-back frequency alone.
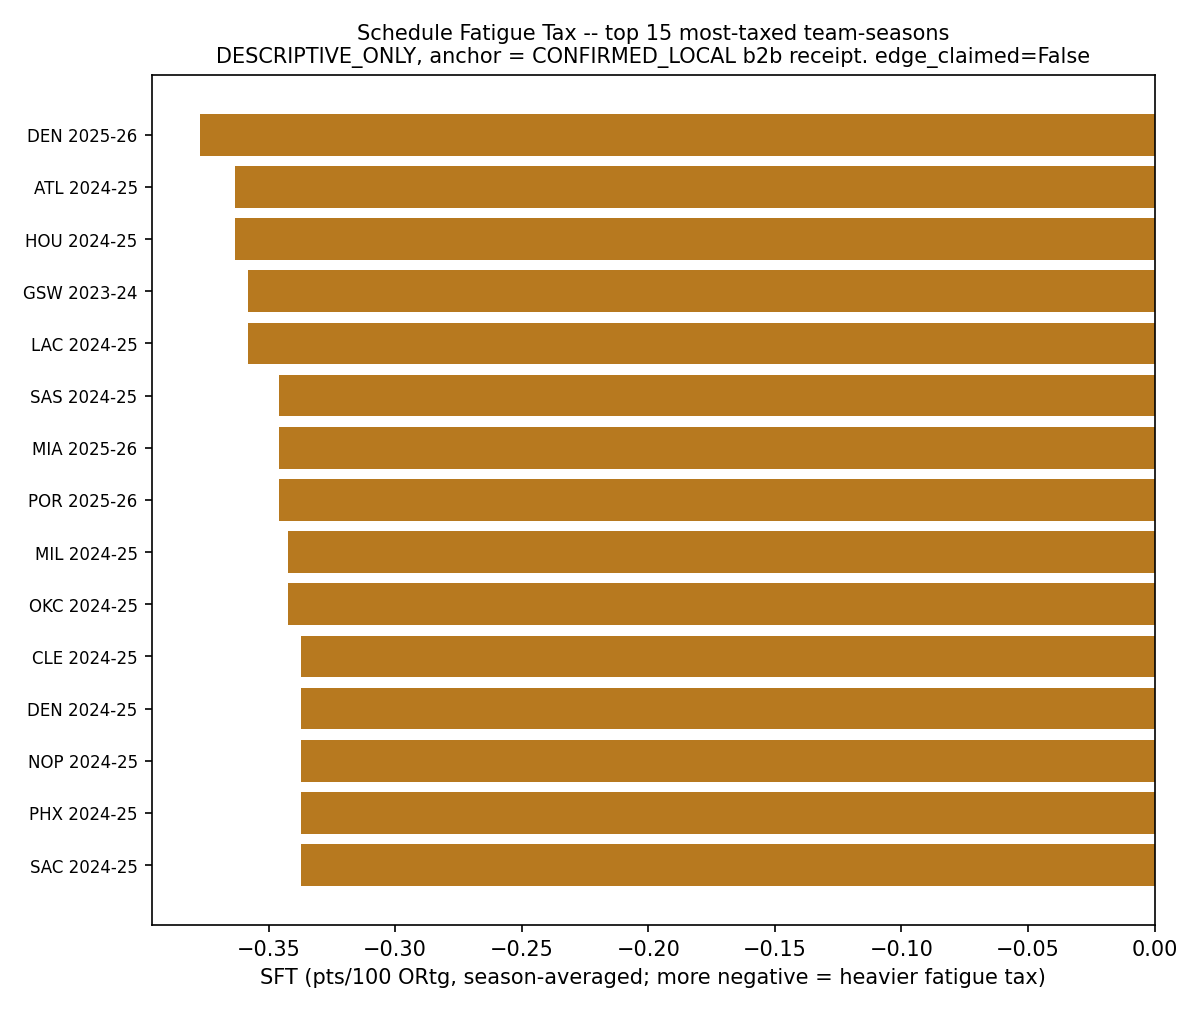
All 90 published team-season Schedule Fatigue Tax values, 2023-24 through 2025-26.
The Load-Bearing Index results below rank the same 30 teams under each estimator separately. Only 1 of 30 teams is named by both estimators (IND, Pascal Siakam), an agreement rate of 0.0333 (agreement_summary.n_agree over agreement_summary.n_teams_both_estimators).
| Team | Most load-bearing player | Delta win probability | On/off net rating delta |
|---|---|---|---|
| DEN | Nikola Jokic | 0.5822 | 23.713 |
| OKC | Shai Gilgeous-Alexander | 0.5171 | 15.763 |
| LAL | Dorian Finney-Smith | 0.4656 | 14.944 |
| MIL | Giannis Antetokounmpo | 0.4441 | 14.231 |
| LAC | Ivica Zubac | 0.4051 | 11.965 |
| MIN | Naz Reid | 0.2092 | 5.85 |
| WAS | Richaun Holmes | 0.2032 | 14.126 |
| CHA | Moussa Diabate | 0.1505 | 7.99 |
| DET | Tobias Harris | 0.1447 | 4.139 |
| PHI | Guerschon Yabusele | 0.1371 | 5.279 |
novel_load_bearing_index.json, results[].estimator_a_elo_onoff (top five and bottom five of 30 teams). Estimator A does not publish a game-count denominator for this comparison; read the win-probability delta and net-rating delta together, without a sample-size column, and see Limitations.
| Team | Most load-bearing player | Delta win rate | Games active (n) | Games missed (n) |
|---|---|---|---|---|
| CHA | Brandon Miller | 0.4543 | 65 | 17 |
| LAC | Brook Lopez | 0.4038 | 75 | 7 |
| POR | Rayan Rupert | 0.3988 | 48 | 7 |
| MIL | Kyle Kuzma | 0.3659 | 69 | 12 |
| DET | Duncan Robinson | 0.3532 | 77 | 5 |
| TOR | Immanuel Quickley | 0.169 | 70 | 12 |
| SAC | Maxime Raynaud | 0.1588 | 74 | 8 |
| PHX | Ryan Dunn | 0.1548 | 70 | 12 |
| MIN | Jaden McDaniels | 0.1027 | 73 | 8 |
| BOS | Neemias Queta | 0.0842 | 76 | 5 |
novel_load_bearing_index.json, results[].estimator_b_raw_withwithout (top five and bottom five of 30 teams). Games active plus games missed is each player's own available games inside that tenure window, not a full 82-game schedule; teams differ in total games covered.
CHA, LAC, MIL and DET each appear in the estimator B top five while sitting outside the estimator A top five for the same team, which illustrates that the two estimators frequently disagree on magnitude as well as on which player is named.
5 Robustness and what would falsify this
The tested rest effect is recorded twice, at n=4732 and at n=7192, both landing on a negative margin difference of the same sign and similar size (-1.73 and -1.955 points per 100 offensive rating, p 0.005645490426098632 and 0.0001174325580081608). What that does and does not establish is worth stating exactly. It establishes that a second, larger recorded run reproduced the sign and rough magnitude of the first. It does not establish an out-of-sample replication: both runs carry the same corpus tag, and the ledger records no relationship between the two row sets, so whether the 4,732 rows are a subset of the 7,192 is simply not recorded and cannot be assumed either way. The project's standing discipline treats a single-corpus result as unconfirmed until it clears a second, independently sourced corpus; this note does not claim that second corpus exists for b2b_rest_penalty.
A falsifying result for reading SFT as team-specific, rather than schedule-inequality-driven, would be a team-by-schedule interaction test showing that some teams absorb a back-to-back worse or better than the leaguewide -1.73 anchor predicts. No such interaction test is published here, so the current ranking should be read as which teams were exposed to more back-to-backs, not which teams are more fatigue-prone.
For LBI, a robustness check would run both estimators on the same season for the same 30 teams; the agreement rate would be expected to rise if the underlying signal were estimator-independent. At 1 of 30 (3.33 percent) across two different seasons, the current data does not support treating either estimator's top-named player as validated. Running estimator B on the 2024-25 season, matching estimator A's window, would be the natural next check.
6 Limitations
This note does not establish that any specific team-season carries a fatigue effect different from the leaguewide average, because SFT is that average effect multiplied through a team's own schedule exposure, not a team-specific estimate. It does not establish that a team's win outcome causally depends on the named load-bearing player, because both LBI estimators are raw associational comparisons across games that player did or did not play, with roster, opponent, rest and blowout-substitution differences uncontrolled. And it does not establish one shared population for the load-bearing comparison, because the two estimators are drawn from different NBA seasons.
- SFT ranks team-seasons by a constant leaguewide effect times each team's own back-to-back frequency, so the ranking is mathematically the same as ranking by back-to-back frequency alone.
- The two b2b_rest_penalty runs (n=4732 and n=7192) share one corpus tag and the overlap between their rows is not recorded, so they are not two independent samples; rest days are chosen by the schedule-maker rather than assigned at random, so either run is an association, not a randomized comparison.
- The two LBI estimators cover different seasons (2024-25 versus 2025-26 through 2026-04-12), so their 1-of-30 agreement is cross-season corroboration, not a paired estimate.
- Both measures aggregate to the team level and do not adjust for roster changes, opponent strength, minutes distribution, or blowout-driven lineup substitutions.
- Estimator A publishes no game-count denominator, so its ranking cannot be weighted by sample support the way estimator B's active and missed game counts allow.
7 How to read this on the site
The observation-dependence inspector explains how sample size and observation windows change what a descriptive number can support; the same caution applies to every n and every as_of window cited above. The published figure for the Schedule Fatigue Tax module sits alongside its underlying rows in the analytics library. The nba-schedule-compression-profile analysis exposes the same schedule_density.json rows behind an equal-weight compression index, a different summary of the same schedule shape, not a duplicate of SFT. The star-removal-team-win-probability and lineup-proxy-active-missed-record analyses expose the scenarios and player tenure windows feeding LBI's two estimators. Read a team's SFT or LBI number next to its row there before treating either ranking as a settled profile.
Evidence
- novel_schedule_fatigue_tax.jsondate not publishedSource path: /analytics/m/novel_schedule_fatigue_tax/
Evidence field inventory (20 paths)
- results[].team
- results[].season
- results[].b2b_games
- results[].b2b_freq
- results[].sft_credible_pts_per100_ortg
- results[].sft_descriptive_composite_per36
- schedule_inequality.n_team_seasons
- schedule_inequality.sft_credible_min
- schedule_inequality.sft_credible_max
- schedule_inequality.sft_credible_range
- schedule_inequality.sft_credible_std
- schedule_inequality.b2b_freq_min
- schedule_inequality.b2b_freq_max
- schedule_inequality.per_season_b2b_freq_range
- mechanism_receipt.effect_cited_from_receipt
- b2b_ortg_effect_pts_per100
- composite_per36_delta_vs_rested
- formula
- declared_confounds
- headline
- schedule_density.jsondate not publishedSource path: /analytics/m/schedule_density/
Evidence field inventory (16 paths)
- input_coverage.rows
- input_coverage.team_games_total
- input_coverage.team_seasons_reported
- input_coverage.player_games_pooled
- input_coverage.rested_player_games
- rested_baseline_per36.composite_per36
- per36_deltas.b2b.n_player_games
- per36_deltas.b2b.composite_per36
- per36_deltas.b2b.composite_per36_delta_vs_rested
- per36_deltas.3in4.n_player_games
- per36_deltas.3in4.composite_per36
- per36_deltas.3in4.composite_per36_delta_vs_rested
- per36_deltas.4in6.n_player_games
- per36_deltas.4in6.composite_per36
- per36_deltas.4in6.composite_per36_delta_vs_rested
- not_this
- mechanism_ledger_export.jsondate not publishedSource path: /analytics/m/mechanism_ledger_export/
Evidence field inventory (4 paths)
- headline_insight
- what_it_means
- cited[]
- as_of
- mechanism_ledger_export.jsondate not publishedSource path: /analytics/m/mechanism_ledger_export/
Evidence field inventory (14 paths)
- source
- by_sport.basketball_nba.mechanisms[mechanism=b2b_rest_penalty].mechanism
- by_sport.basketball_nba.mechanisms[mechanism=b2b_rest_penalty,effect=-1.73].effect
- by_sport.basketball_nba.mechanisms[mechanism=b2b_rest_penalty,effect=-1.73].p
- by_sport.basketball_nba.mechanisms[mechanism=b2b_rest_penalty,effect=-1.73].corpus
- by_sport.basketball_nba.mechanisms[mechanism=b2b_rest_penalty,effect=-1.73].evidence
- by_sport.basketball_nba.mechanisms[mechanism=b2b_rest_penalty,effect=-1.73].verdict
- by_sport.basketball_nba.mechanisms[mechanism=b2b_rest_penalty,effect=-1.73].as_of
- by_sport.basketball_nba.mechanisms[mechanism=b2b_rest_penalty,effect=-1.955].effect
- by_sport.basketball_nba.mechanisms[mechanism=b2b_rest_penalty,effect=-1.955].p
- by_sport.basketball_nba.mechanisms[mechanism=b2b_rest_penalty,effect=-1.955].corpus
- by_sport.basketball_nba.mechanisms[mechanism=b2b_rest_penalty,effect=-1.955].evidence
- by_sport.basketball_nba.mechanisms[mechanism=b2b_rest_penalty,effect=-1.955].verdict
- by_sport.basketball_nba.mechanisms[mechanism=b2b_rest_penalty,effect=-1.955].as_of
- novel_load_bearing_index.jsondate not publishedSource path: /analytics/m/novel_load_bearing_index/
Evidence field inventory (16 paths)
- as_of.estimator_a
- as_of.estimator_b
- agreement_summary.n_teams_both_estimators
- agreement_summary.n_agree
- agreement_summary.agree_rate
- results[].team
- results[].estimator_a_elo_onoff.player_name
- results[].estimator_a_elo_onoff.delta_winprob
- results[].estimator_a_elo_onoff.on_off_net_rating_delta
- results[].estimator_b_raw_withwithout.player_name
- results[].estimator_b_raw_withwithout.delta_win_rate
- results[].estimator_b_raw_withwithout.n_active
- results[].estimator_b_raw_withwithout.n_missed
- results[].agreement_same_player
- declared_confounds
- headline
- nba_consistency_profiles.jsonas_of 2026-04-12Source path: /analytics/m/nba_consistency_profiles/
Evidence field inventory (2 paths)
- methodology.caveat
- not_this[]