Browse › The back-to-back tax, measured in the box score
Analytics module · Date not published.
The back-to-back tax, measured in the box score
Descriptive only
confirmednull (a finding)not testabledescriptivepending
Schedule Density
How to read this figure
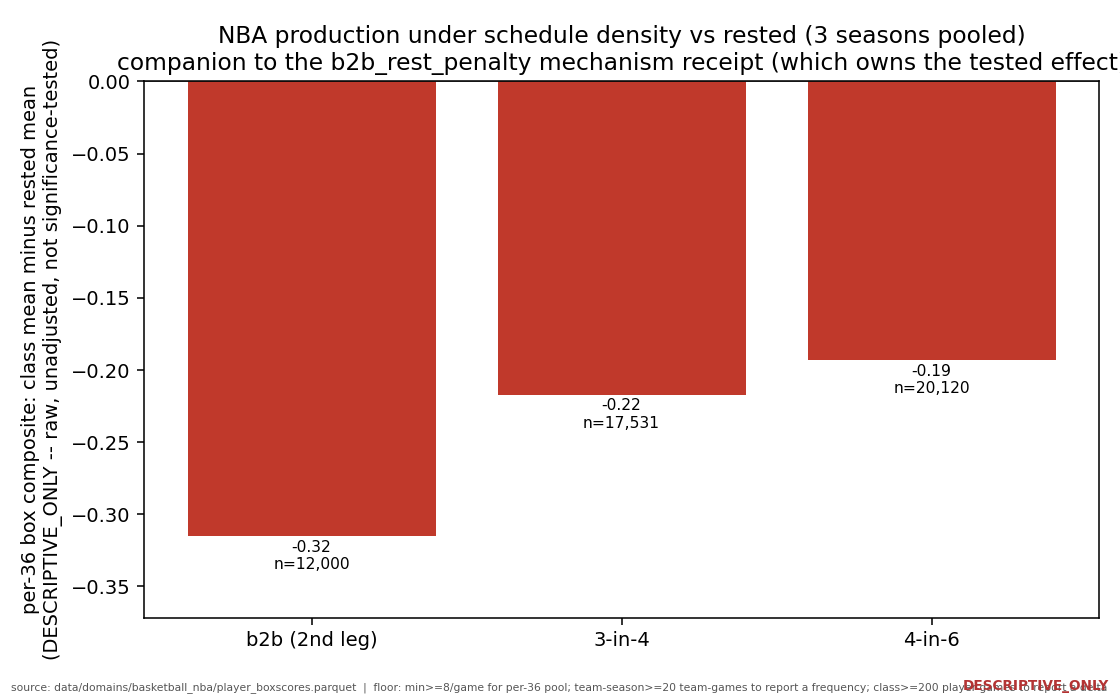
The rested baseline is games with >= 2 days rest and no compression; each density class shows its pooled per-36 mean and the delta beneath the baseline.
Continue with the data
Open the interactive analysis: Which schedules concentrate compressed stretches?What it means
The reported raw pooled per-36 differences are -0.315 for back-to-backs, -0.217 for 3-games-in-4-days, and -0.193 for 4-in-6. These classes overlap, so neither their counts nor their differences should be added -- a back-to-back that closes a cluster is also a 3-in-4.
Caveats and confounds
Descriptive only; raw pooled per-36 means, NOT roster/opponent/minutes/home-away adjusted and NOT significance-tested in this module; overlapping classes are not additive.