Research paper
Pitch velocity shape: what the distribution says, and what it does not
Per-type velocity percentiles and mph bands across 19 published 2025 Statcast pitch-type codes
Abstract
This note describes the shape of pitch velocity by pitch-type code in a local 2025 Statcast pull (source data/cache/statcast/statcast_fuller__2025.parquet), not just its average. statcast_showcase.json publishes 19 pitch-type codes covering 693,037 pitches (n_pitches, pitch_type_distribution); the four-seam fastball (FF) alone accounts for 220,235 of them, 31.78 percent. Sixteen of those 19 codes also carry a published 10th, 50th, and 90th percentile of release speed (velo_percentiles_by_pitch_type); the other three -- UNK, UN, and SC -- appear in the raw count but have no published percentile row. For the two most common shapes, the picture differs by more than the median: the four-seam fastball's middle 80 percent of readings spans 91.3 to 97.7 mph, a 6.4 mph derived spread, while the curveball (CU) spans 75.1 to 83.9 mph, an 8.8 mph spread, around a lower median. mlb_velo_bands.json's fixed-width mph bands make the same point a different way: 89.78 percent of four-seam fastballs land in the three consecutive 89-98 mph bands, while 97.42 percent of curveballs land at or below 86 mph. A percentile or share is only meaningful within the row set it was computed over: the same 693,037 pitches partition into 19 rows by pitch type and, separately, into 12 rows by exact ball-strike count (mlb_count_leverage.json), and pitch_sequencing.json restricts pitch type itself to a further 8-row, 512,289-transition axis with its own floor. None of these row sets are interchangeable, and this paper does not rank pitchers, forecast a next pitch, or make any predictive claim beyond description.
1 Question
What does the velocity distribution of a single 2025 MLB pitch-type code look like, beyond its average? statcast_showcase.json answers this with three published percentiles per code -- the 10th, 50th, and 90th -- in velo_percentiles_by_pitch_type, alongside a separate 19-row pitch_type_distribution that gives every code's raw pitch count and share of all 693,037 pitches thrown (n_pitches). This paper reads those two arrays together, then reads mlb_velo_bands.json's fixed mph-band histogram for the same pitches, to describe the shape of velocity within a pitch type rather than a single center number.
The two published arrays do not line up row for row. pitch_type_distribution lists 19 codes; velo_percentiles_by_pitch_type lists 16. The three missing codes -- UNK (2,544 pitches), UN (13 pitches), and SC (7 pitches) -- are counted in the raw distribution but carry no p10/p50/p90 row, so this paper describes velocity shape for 16 of the 19 published codes and says so plainly rather than filling in the gap.
2 Data and definitions
Both files come from the same local pull: source data/cache/statcast/statcast_fuller__2025.parquet, covering n_pitches = 693,037. Neither file publishes an as_of date, so this paper treats their snapshot date as not published. pitch_type_distribution gives, for each of 19 codes, its raw pitch count and pct of all pitches; velo_percentiles_by_pitch_type gives, for 16 of those codes, its own count (n) and its 10th, 50th, and 90th percentile of release speed in mph. The file's own caveat states plainly that it is a descriptive data-coverage showcase, not a recomputed predictive result.
mlb_velo_bands.json restates the same underlying pitches (n_pitches_raw = 693,037, n_analyzed = 690,490 after dropping pitches with no usable release speed) into nine fixed bands -- band_edges_mph 0, 80, 83, 86, 89, 92, 95, 98, 101, 200, labeled <80 through 101+ -- and reports the share of each pitch type's own pitches that falls in each band, plus that type's median velocity. Its own floor (floors.band_share_min_pitches_per_type = 500) drops any pitch-type code below 500 typed pitches from this table entirely rather than smoothing it in, per floors.note. The three smallest codes that do have a published percentile in velo_percentiles_by_pitch_type -- CS (393), KN (135), and PO (53) -- all fall below that 500 floor and so do not appear in the band table at all.
Two more artifacts appear later only to show that a percentile or a share is not portable across row sets. mlb_count_leverage.json partitions the same 693,037 pitches into 12 rows by exact ball-strike count (by_exact_count). pitch_sequencing.json restricts pitch type itself to an 8-row axis (pitch_types) of the most frequent codes, counting 512,289 pitch-to-pitch transitions rather than pitches (n_transitions).
3 Method
A percentile here means exactly what it means anywhere: velo_percentiles_by_pitch_type[X].p50 is the release speed below which half of that code's own n pitches fall; p10 and p90 bound the middle 80 percent. Two simple, fully derived summaries make the shape easier to compare across types: spread, the width of that middle-80 band, and asymmetry, whether the band stretches farther above or below the median. Both are trivial arithmetic on two cited numbers and are not separately measured fields.
spread = p90 - p10; asymmetry = (p90 - p50) - (p50 - p10); both derived from published p10/p50/p90, not separately measured
The published mlb-velocity-shape analysis on the site computes these same two derived fields, plus an upper-tail share, for every row in velo_percentiles_by_pitch_type (see Related, below); this paper cites three illustrative rows below rather than reproducing that full table a second time.
The harder rule this paper is built around: a percentile, a rank, or a share is only meaningful within the row set, or cohort, it was computed over. pitch_type_distribution's 19 rows and mlb_count_leverage.json's 12 by_exact_count rows both partition the identical 693,037-pitch corpus, but along different axes -- pitch type versus exact count -- so a pitch type's percent of all pitches and a count's percent of all pitches are not two entries in one ranked list; they answer two different questions about the same pitches. pitch_sequencing.json goes a step further: its 8-row pitch-type axis is not even the same population as pitch_type_distribution's 19-row axis, since it excludes every code outside the top 8 by frequency (floors.top_n_pitch_types = 8), and its denominator is 512,289 transitions, not 693,037 pitches. A pitch type's row_n_from in that file is a transition count and cannot be ranked against, added to, or read as a substitute for its pitch count in pitch_type_distribution.
4 Results
Table 1 lists all 19 published pitch-type codes, each one's raw count and share of all pitches (pitch_type_distribution), and its published velocity percentiles where one exists (velo_percentiles_by_pitch_type). The four-seam fastball (FF) is the largest single code at 220,235 pitches, 31.78 percent of the pull; its own velocity-percentile row shows a slightly different count, 220,233, because two four-seamers in the raw count have no usable recorded release speed. The sinker (SI) shows the same one-pitch-off pattern, 107,136 versus 107,135. Every other code's two counts match exactly.
| Pitch type | n (pitches) | Pct of all pitches | n (velocity) | p10 mph | p50 mph | p90 mph |
|---|---|---|---|---|---|---|
| FF | 220,235 | 31.78% | 220,233 | 91.3 | 94.5 | 97.7 |
| SI | 107,136 | 15.46% | 107,135 | 90.3 | 94.0 | 97.2 |
| SL | 99,357 | 14.34% | 99,357 | 82.7 | 86.4 | 89.7 |
| CH | 71,270 | 10.28% | 71,270 | 80.5 | 86.3 | 90.1 |
| ST | 52,681 | 7.6% | 52,681 | 78.7 | 82.7 | 86.2 |
| FC | 51,867 | 7.48% | 51,867 | 86.0 | 89.6 | 93.3 |
| CU | 46,489 | 6.71% | 46,489 | 75.1 | 79.9 | 83.9 |
| FS | 22,473 | 3.24% | 22,473 | 82.2 | 86.3 | 90.9 |
| KC | 12,412 | 1.79% | 12,412 | 77.6 | 83.0 | 87.5 |
| SV | 3,427 | 0.49% | 3,427 | 78.6 | 81.8 | 85.0 |
| UNK | 2,544 | 0.37% | n/a | n/a | n/a | n/a |
| EP | 970 | 0.14% | 970 | 38.9 | 50.1 | 60.3 |
| FA | 854 | 0.12% | 854 | 58.5 | 67.9 | 79.8 |
| FO | 721 | 0.10% | 721 | 80.9 | 83.0 | 85.6 |
| CS | 393 | 0.06% | 393 | 52.3 | 72.4 | 74.9 |
| KN | 135 | 0.02% | 135 | 56.8 | 77.4 | 83.0 |
| PO | 53 | 0.01% | 53 | 85.7 | 91.4 | 94.9 |
| UN | 13 | 0.00% | n/a | n/a | n/a | n/a |
| SC | 7 | 0.00% | n/a | n/a | n/a | n/a |
n (pitches) and pct of all pitches: statcast_showcase.json, pitch_type_distribution, n_pitches=693,037. n (velocity), p10/p50/p90: statcast_showcase.json, velo_percentiles_by_pitch_type. Date not published on this artifact.
Reading percentiles alone can hide how much of a type's mass sits where. mlb_velo_bands.json's band table for the two largest, most differently shaped codes -- FF and the curveball (CU) -- makes the shape concrete (Table 2). FF's mass concentrates in three consecutive bands: 89-92 (13.06 percent), 92-95 (41.94 percent), and 95-98 (34.78 percent) sum to 89.78 percent of its 220,233 typed pitches, a derived sum of three published shares. CU's mass sits almost entirely at or below 86 mph: <80 (50.41 percent), 80-83 (33.65 percent), and 83-86 (13.36 percent) sum to 97.42 percent of its 46,489 typed pitches.
| Band (mph) | FF share pct (n=220,233) | CU share pct (n=46,489) |
|---|---|---|
| <80 | 0.0 | 50.41 |
| 80-83 | 0.0 | 33.65 |
| 83-86 | 0.2 | 13.36 |
| 86-89 | 1.58 | 2.5 |
| 89-92 | 13.06 | 0.08 |
| 92-95 | 41.94 | 0.0 |
| 95-98 | 34.78 | 0.0 |
| 98-101 | 8.0 | 0.0 |
| 101+ | 0.44 | 0.0 |
FF median 94.5 mph, CU median 79.9 mph. Source: mlb_velo_bands.json, velo_band_shares_by_pitch_type[pitch_type=FF/CU].band_share_pct, floors.band_share_min_pitches_per_type=500 (both types clear the floor).
consecutive_band_sum = sum of adjacent published band_share_pct values; derived, not a separately measured field
Published velocity-band chart (mlb_velo_bands.json): share of pitches in each fixed mph band, by pitch type.
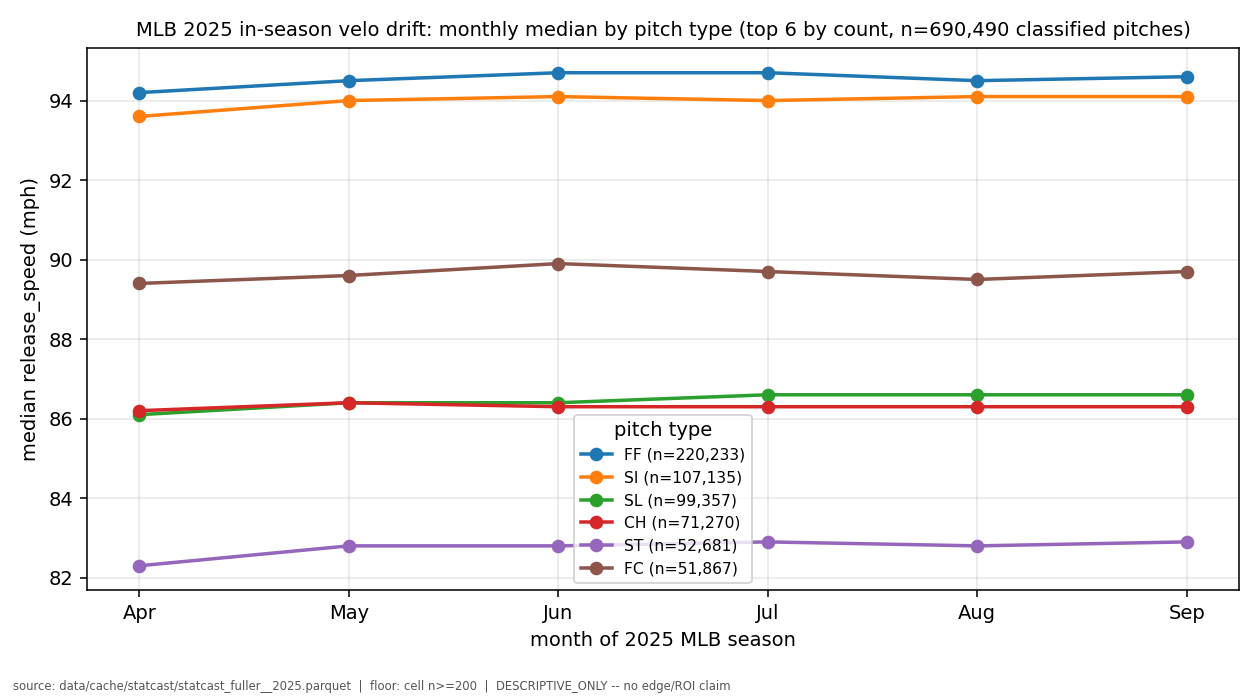
The shape is stable within a season. mlb_velo_bands.json's monthly_drift_by_pitch_type shows the four-seam fastball's median velocity moving from 94.2 mph in April to 94.6 mph in September, a 0.4 mph delta over 220,233 pitches and 6 months -- a small, known in-season velocity ramp, not a change in the fastball's overall shape.
The cohort point is not abstract. mlb_count_leverage.json's by_exact_count table partitions the identical 693,037 pitches into 12 rows by exact ball-strike count, and those 12 rows sum to exactly 693,037 -- the same total pitch_type_distribution's 19 rows sum to. The 0-0 count alone carries 178,407 pitches, 25.74 percent of all pitches, a derived ratio (178,407 / 693,037). The four-seam fastball is the published top_pitch_type in all 12 exact counts, but its top_pitch_pct within each count ranges from 27.95 percent (1-1) to 65.12 percent (3-0, n=7,457) -- a type's share of a single count is a different number, over a different denominator, from that same type's 31.78 percent share of all pitches in pitch_type_distribution. Ranking or averaging across those two row sets treats two different questions as one.
pitch_sequencing.json narrows pitch type again, to its own 8-code axis (pitch_types: FF, SI, SL, CH, ST, FC, CU, FS), floored at row_min_n = 200 pitches per row and class_min_transitions = 2,000 transitions per count-leverage class. Its row_n_from for FF in the unconditional class is 165,179 -- a count of fastball-led transitions among 512,289 total transitions (n_transitions), not a count of fastball pitches among 693,037 total pitches (n_pitches_total). The two 165-thousand-and-220-thousand-scale numbers describe different things and should not be compared as if they were the same rank.
5 Robustness and what would falsify this
Two codes in the published velocity table have very small n: PO (53 pitches, p10 85.7, p50 91.4, p90 94.9) and KN (135 pitches, p10 56.8, p50 77.4, p90 83.0). Their percentiles are published exactly like every other row's, but a percentile computed over 53 or 135 pitches carries far more sampling noise than one computed over 220,233; this paper does not treat PO's or KN's shape as comparably solid to FF's or SL's.
What would undercut the reading that FF and CU have genuinely different shapes, not just different medians: if their middle-80 spreads were close despite the gap in p50. They are not. FF's spread is 6.4 mph (97.7 - 91.3) and CU's is 8.8 mph (83.9 - 75.1), so CU is both slower and wider, not just shifted down by a constant amount. The eephus (EP) is wider still, 21.4 mph (60.3 - 38.9) on only 970 pitches, consistent with a rare, deliberately variable pitch rather than a repeatable one.
This is a single local 2025 pull from one source file, pooled across every pitcher, park, and month; it is not cross-checked against a second season or a second data source in this paper.
6 Limitations
This is a within-season, within-corpus description of published percentiles and band shares, not a validated finding across multiple pulls or a model of any individual pitcher.
- Single local 2025 Statcast pull (data/cache/statcast/statcast_fuller__2025.parquet) and a single snapshot; neither statcast_showcase.json nor mlb_velo_bands.json publishes an as_of date, and this paper does not cross-check a second season.
- League-aggregate, not pitcher-specific: every percentile and band share pools every pitcher who threw that code in 2025; one pitcher's repertoire can sit anywhere within, or outside, these published ranges.
- Three pitch-type codes (UNK, UN, SC) have a published pitch count but no published velocity percentile, and this paper does not estimate one for them.
- Percentiles, shares, and ranks from different published row sets (pitch type, exact count, or the pitch-sequencing transition axis) are not interchangeable; this paper treats each as valid only within its own published cohort.
- Descriptive only: no forecast, no calibration check, and no claim about any single pitcher's next pitch or velocity.
7 How to read this on the site
On the site, the per-type band histogram in Table 2 corresponds to the published mlb_velo_bands figure above; the full 16-row percentile table backs the mlb-velocity-shape analysis, and the 19-row raw distribution backs mlb-pitch-mix-concentration (see Related). The pitch-sequencing inspector uses a different, narrower pitch-type axis for a different question -- what pitch follows a given pitch -- and its transition counts should not be read against the pitch-type or count-state shares reported here. A separate site pack, entity_percentiles, ranks published entities including pitch types for size and share fields; it is linked below as a module for readers who want that ranked view, not as a source of any number used in this paper.
Evidence
- statcast_showcase.jsondate not publishedSource path: /analytics/m/statcast_showcase/
Evidence field inventory (35 paths)
- source
- n_pitches
- caveat
- pitch_type_distribution[].pitch_type
- pitch_type_distribution[].n
- pitch_type_distribution[].pct
- pitch_type_distribution[pitch_type=FF].n
- pitch_type_distribution[pitch_type=FF].pct
- pitch_type_distribution[pitch_type=SI].n
- pitch_type_distribution[pitch_type=UNK].n
- pitch_type_distribution[pitch_type=UNK].pct
- pitch_type_distribution[pitch_type=UN].n
- pitch_type_distribution[pitch_type=SC].n
- velo_percentiles_by_pitch_type[].pitch_type
- velo_percentiles_by_pitch_type[].n
- velo_percentiles_by_pitch_type[].p10
- velo_percentiles_by_pitch_type[].p50
- velo_percentiles_by_pitch_type[].p90
- velo_percentiles_by_pitch_type[pitch_type=FF].n
- velo_percentiles_by_pitch_type[pitch_type=FF].p10
- velo_percentiles_by_pitch_type[pitch_type=FF].p90
- velo_percentiles_by_pitch_type[pitch_type=SI].n
- velo_percentiles_by_pitch_type[pitch_type=CU].p10
- velo_percentiles_by_pitch_type[pitch_type=CU].p90
- velo_percentiles_by_pitch_type[pitch_type=EP].n
- velo_percentiles_by_pitch_type[pitch_type=EP].p10
- velo_percentiles_by_pitch_type[pitch_type=EP].p90
- velo_percentiles_by_pitch_type[pitch_type=PO].n
- velo_percentiles_by_pitch_type[pitch_type=PO].p10
- velo_percentiles_by_pitch_type[pitch_type=PO].p50
- velo_percentiles_by_pitch_type[pitch_type=PO].p90
- velo_percentiles_by_pitch_type[pitch_type=KN].n
- velo_percentiles_by_pitch_type[pitch_type=KN].p10
- velo_percentiles_by_pitch_type[pitch_type=KN].p50
- velo_percentiles_by_pitch_type[pitch_type=KN].p90
- mlb_velo_bands.jsondate not publishedSource path: /analytics/m/mlb_velo_bands/
Evidence field inventory (14 paths)
- n_pitches_raw
- n_analyzed
- band_edges_mph
- band_labels
- floors.band_share_min_pitches_per_type
- floors.note
- velo_band_shares_by_pitch_type[pitch_type=FF].n
- velo_band_shares_by_pitch_type[pitch_type=FF].median_velo
- velo_band_shares_by_pitch_type[pitch_type=FF].band_share_pct
- velo_band_shares_by_pitch_type[pitch_type=CU].n
- velo_band_shares_by_pitch_type[pitch_type=CU].median_velo
- velo_band_shares_by_pitch_type[pitch_type=CU].band_share_pct
- monthly_drift_by_pitch_type[pitch_type=FF].median_velo_delta_first_to_last_mph
- monthly_drift_by_pitch_type[pitch_type=FF].months
- mlb_count_leverage.jsonas_of 2026-07-25Source path: /analytics/m/mlb_count_leverage/
Evidence field inventory (11 paths)
- n_pitches_total
- floors.class_min_n
- by_exact_count[].n
- by_exact_count[].balls
- by_exact_count[].strikes
- by_exact_count[].top_pitch_type
- by_exact_count[].top_pitch_pct
- by_exact_count[balls=0,strikes=0].n
- by_exact_count[balls=1,strikes=1].top_pitch_pct
- by_exact_count[balls=3,strikes=0].n
- by_exact_count[balls=3,strikes=0].top_pitch_pct
- pitch_sequencing.jsonas_of 2026-07-25Source path: /analytics/m/pitch_sequencing/
Evidence field inventory (8 paths)
- n_pitches_total
- n_transitions
- pitch_types
- floors.top_n_pitch_types
- floors.row_min_n
- floors.class_min_transitions
- by_class[class=all].top_transition.from
- by_class[class=all].top_transition.n