Statcast Showcase
The 2025 Statcast pull holds 693,037 pitches, and the framing ingredients (plate location, zone boundaries) are present on 99.63% of them.
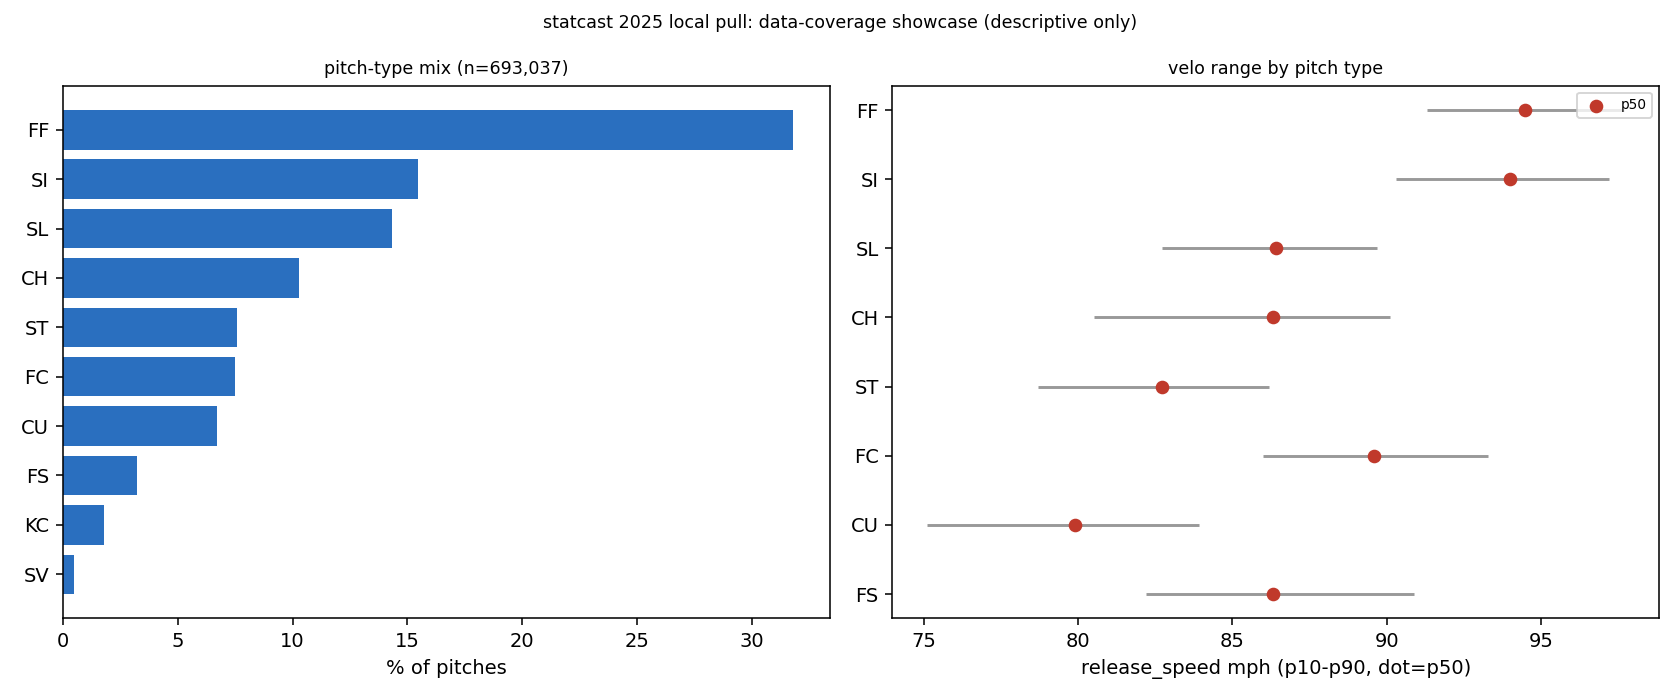
How to read this figure
The distribution table is the pitch-type mix, the percentile table is velocity by pitch type, and the coverage table is column completeness. The framing block is cited context, not recomputed in this showcase.
What it means
That coverage is enough to compute catcher-framing-style metrics from location. Four-seam fastballs are the most common pitch at 31.78% of the pull, sinkers next at 15.46%. A separate preregistered framing check (surfaced here as context only) reports a borderline called-strike-rate metric tracking its target more tightly than a declared naive baseline, with the sign holding in 7 of 8 folds and a verdict of PREDICTIVE_VERIFIED.
Caveats and confounds
Descriptive data-coverage only; this showcase does NOT recompute any predictive-validity result. The framing rho is context carried from a corpus-deviation recompute (cutoffs shifted one season to match data that exists), compared to a declared naive baseline, never versus the market close.