MLB Count Leverage
Descriptive only
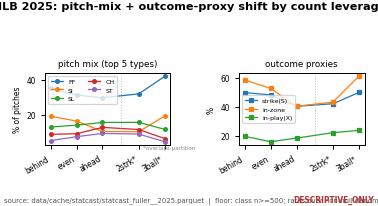
How to read this figure
The chart shows pitch-type mix by count-leverage class; the table breaks it down to each exact ball-strike count. Every rate is over its own non-null denominator, not the raw class count.
What it means
Count state strongly shapes what gets thrown. In a must-throw-a-strike 3-0 hole the four-seam share (65.12%) roughly doubles its ~30% share in even and ahead counts, and the in-zone rate climbs because the hitter usually is not swinging. As the pitcher gets ahead the mix broadens toward sliders and changeups and the in-zone rate drops.
Caveats and confounds
Descriptive only over the local 2025 Statcast pull; the type==S strike rate conflates called, swinging and foul strikes (no per-pitch swing/take in this corpus). It reports the observed pitch mix rather than a forecast.