Research paper
Comebacks by deficit and time
How often an NBA side that is behind at a given moment goes on to win, by deficit size and time remaining, with every cell's support
Abstract
This paper measures how often a side that is behind at a given moment in an NBA game goes on to win, broken out by how large the deficit is and by how much game time remained when that deficit was observed. The population is not one row per game; it is one row per recorded in-play tick, grouped into cells by deficit-magnitude band and time-remaining band, drawn from webapp/public/data/showcase/comeback_atlas.json, a reshaping of the NBA state-bucket calibration grid, as of 2026-09-17. Within a cell the reported win frequency is a tick-weighted mean of the eventual game outcome, not a game-weighted mean, so a game that lingers in a cell pulls that cell's rate toward its own result more than one that passes through briefly. The main table follows the source's own sign convention: the deficit side described is the home side while it trails. Across 46 published cells spanning a tied score plus six deficit bands (1-5 through 30-plus points) and up to seven time-remaining bands, the pattern is monotone in both directions at once: bigger deficits and less remaining time both push the come-back frequency toward zero, from 50.87% at a 1-5 point deficit with more than 36 minutes left (n=1,300 games) to 0.00% at a 30-plus point deficit inside the final two minutes (n=65 games). Four of the 46 cells sit below the source's 30-game floor and are reported with raw counts but flagged, never smoothed. This is a historical frequency table built from realized outcomes, not a live forecast, a model, or a price.
1 Question
Announcers and viewers both reach for the same shorthand: once a deficit gets big enough, or the clock short enough, a game is decided well before the final buzzer. This paper turns that shorthand into a measurement, for the NBA only. For an in-play state defined jointly by deficit size and time remaining, how often does the side behind at that moment go on to win.
A companion module, blowout_dynamics, asks a related but different question for two other sports (MLB, international soccer): once a margin reaches a given size, does it ever get closed back below it before the last recorded tick. That is a persistence question about the margin itself, not conditioned on time remaining the way this paper's cells are. The two are contrasted only for definitions, and share no numbers.
Two definitions need pinning down before any number here means anything. 'Trailing' is defined by the sign of the home side's scoring margin (home score minus away score) at a recorded tick; the source's cells label a negative margin of a given size as that magnitude's deficit band, and this paper's main table follows that convention throughout. 'Comeback' means the game that produced that tick ended in a win for the side that was behind at that moment. Neither definition looks at a price or a forecast; both come from the scoreboard and the final result.
2 Data and definitions
The source artifact is webapp/public/data/showcase/comeback_atlas.json, published as the comeback_atlas module; its as-of date is 2026-09-17, in the artifact and the site manifest alike. It carries 84 cells total (n_buckets_total), 7 below its own 30-game floor (n_buckets_masked_n_lt_30) and 77 clearing it (n_buckets_unmasked). This paper's main table uses 46 of the 84: the tied-score band plus the six deficit bands on the home-behind side of the grid. The remaining 38 are mirror-image states where the home side leads instead; two are used only in the robustness check below, never merged into the main table.
The population behind every cell is recorded in-play ticks, not one row per game. The source's own honest note (source_honest_note) says it directly: aggregates in this file are tick-weighted, not game-weighted, so 'a bucket with more ticks from one game pulls its own average, stated here rather than hidden.' Each cell's n_games counts the distinct games that produced a tick in that deficit-and-time combination and n_ticks how many ticks did so; since a game's outcome is fixed, a game that lingers in one cell pulls that cell's rate further than one passing through. Recorded ticks per cell range from 10 (the smallest, masked cell) to 26,824 (the 5-10 point band in the final two minutes, where stoppages generate many ticks).
The masking rule is the artifact's own (mask_rule field): a cell is excluded from any headline number when n_games is below 30, the same floor the underlying calibration grid's can_price gate uses, but it stays listed in the cells array with masked_n_lt_30 true, never silently dropped. Four of the 46 cells here are masked this way: a 10-15 point deficit in overtime (n_games=3), a 20-30 point deficit with more than 36 minutes left (n_games=26), and a 30-plus point deficit with either 24-36 minutes left (n_games=16) or more than 36 minutes left (n_games=1, the smallest cell in the atlas). Their raw counts are shown below, flagged, with no rate read from them.
3 Method
This paper does not compute a new statistic from raw play-by-play. It reads one published, already-aggregated file and reshapes its cells into a deficit-by-time table, as the source module's own novelty note describes its contribution: it takes the existing NBA reliability map and 'reshapes into a 2D lead x time-remaining atlas instead of a single time-checkpoint curve,' flagged incremental rather than a new method (novelty.verdict = 'INCREMENTAL'). This paper reuses only the outcome side of that published cell structure, never a model or price number from it.
Each cell groups ticks by two bands: a deficit-magnitude band (six bands from 1-5 points up to 30-plus, plus a tied band) and a time-remaining band (six regulation windows from more than 36 minutes left down to the final two minutes, plus a separate overtime band with no regulation clock reading). Overtime only opens from a tied score and is short, so large deficits essentially never occur there -- three of the six deficit bands (15-20, 20-30, 30-plus) have no overtime cell, not because it was masked but because no tick was recorded. The one-sided reading below (home side trailing) is a direct read of the source's cells; the only computed number in this paper is the trivial complement (one minus a cited rate) used in the robustness check, labeled as such.
4 Results
The table reads left to right in game order: more than 36 minutes remaining on the left, through the final two minutes, to overtime on the right. Each cell gives the tick-weighted come-back frequency and the distinct games behind it (n); masked cells show their raw game count with no rate, and a blank cell recorded no ticks.
| Deficit (home points behind) | 36+ min left | 24-36 min left | 12-24 min left | 5-12 min left | 2-5 min left | 0-2 min left | Overtime |
|---|---|---|---|---|---|---|---|
| Tied (0) | 54.06% (n=1317) | 55.30% (n=579) | 57.12% (n=459) | 51.85% (n=281) | 54.34% (n=166) | 44.52% (n=201) | 58.61% (n=80) |
| 1-5 | 50.87% (n=1300) | 47.90% (n=880) | 45.47% (n=683) | 40.52% (n=493) | 39.19% (n=361) | 1.29% (n=348) | 3.47% (n=58) |
| 5-10 | 39.89% (n=816) | 34.94% (n=739) | 29.77% (n=615) | 22.69% (n=458) | 16.99% (n=334) | 0.07% (n=295) | 1.04% (n=31) |
| 10-15 | 29.73% (n=339) | 24.25% (n=506) | 15.33% (n=456) | 10.28% (n=353) | 1.87% (n=236) | 0.00% (n=225) | masked (n=3) |
| 15-20 | 23.89% (n=95) | 14.61% (n=255) | 8.67% (n=311) | 3.47% (n=249) | 0.00% (n=180) | 0.00% (n=159) | no ticks recorded |
| 20-30 | masked (n=26) | 9.43% (n=120) | 2.80% (n=205) | 0.20% (n=191) | 0.00% (n=149) | 0.00% (n=128) | no ticks recorded |
| 30+ | masked (n=1) | masked (n=16) | 0.00% (n=49) | 0.00% (n=62) | 0.00% (n=64) | 0.00% (n=65) | no ticks recorded |
Source: webapp/public/data/showcase/comeback_atlas.json, cells[] filtered to lead_band='lead_00' or lead_band starting 'lead_-'; rate = outcome_rate x 100, n = n_games. masked = masked_n_lt_30 true (n_games below the published 30-game floor); 'no ticks recorded' = no cell exists for that combination.
The pattern is monotone along both axes at once. Reading a row left to right, the frequency falls as less time remains: for a 5-10 point deficit it runs 39.89% (more than 36 minutes left, n=816) down to 0.07% (final two minutes, n=295). Reading a column top to bottom, it falls as the deficit grows: with 12-24 minutes left it runs 57.12% at a tied score down to 0.00% at 30-plus points (n=49). No deficit row exceeds the tied row in the same time column, and every deficit row's final-two-minutes cell is below 2% except the 1-5 point band, at 1.29%.
- Masked-cells summary (below the 30-game floor, raw counts shown, no rate reported): 10-15 point deficit in overtime, n_games=3; 20-30 point deficit with more than 36 minutes left, n_games=26; 30-plus point deficit with 24-36 minutes left, n_games=16; 30-plus point deficit with more than 36 minutes left, n_games=1 (the smallest cell in the atlas).
- Structurally absent cells (no ticks recorded, not masked): overtime for the 15-20, 20-30, and 30-plus point deficit bands -- overtime opens from a tied score and lasts only a few minutes, so this corpus never recorded a tick that far behind during overtime play.
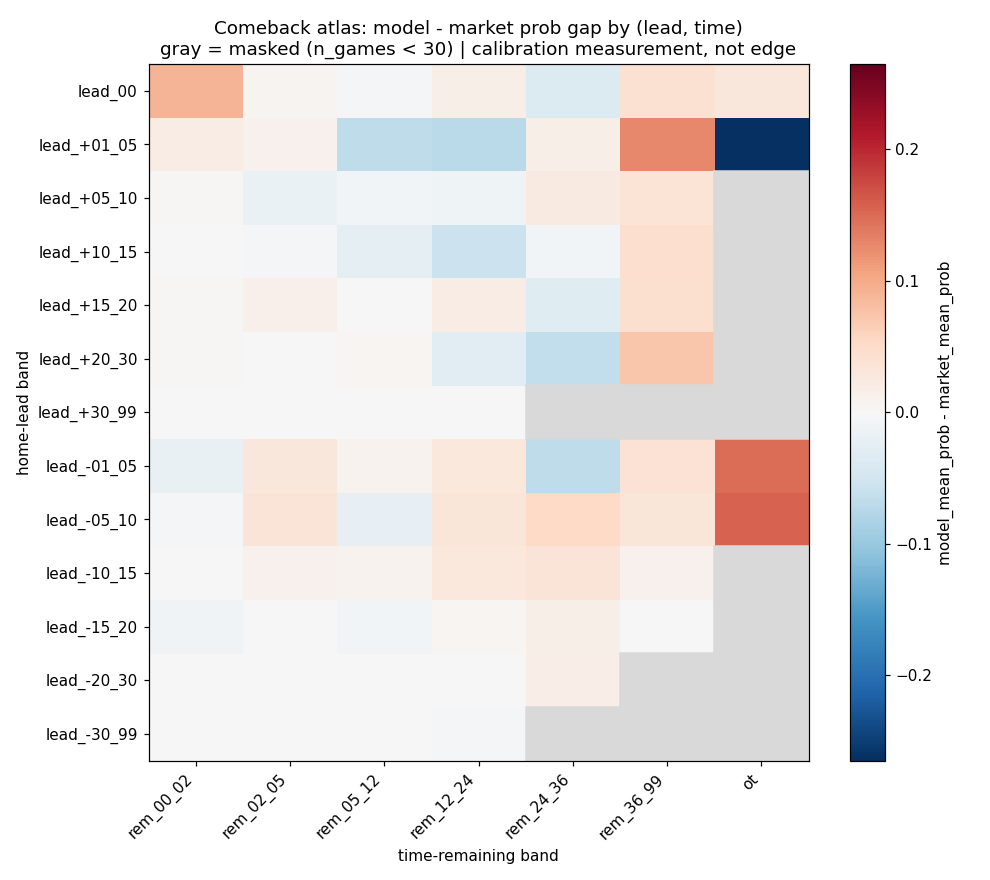
Published lead-by-time-remaining atlas (comeback_atlas module); the table above restates its home-trailing cells as come-back frequency, with masked and absent cells marked the same way the source module marks them.
5 Robustness and what would falsify this
The source's grid also carries the mirror-image cells, where the home side holds the lead instead of trailing (the lead_+ bands). One minus that cell's outcome_rate is an independent estimate of the away side's come-back frequency in the same deficit-and-time combination, drawn from an entirely different set of games than the home-trailing cell above it. This paper does not fold that estimate into the main table -- it is shown here only as a check on whether two independent samples of the same deficit-and-time question roughly agree.
| Deficit and time | Home-trailing cell (direct) | Away-trailing estimate (1 - home-leading rate) | Agreement |
|---|---|---|---|
| 1-5 points, final two minutes | 1.29% (n=348) | 1.35% (n=344, 1 - 98.65%) | Close: within 0.06 points on similarly sized samples |
| 5-10 points, 12-24 minutes left | 29.77% (n=615) | 25.01% (n=736, 1 - 74.99%) | Looser: about 4.8 points apart |
Away-trailing figures are a trivial complement (1 - outcome_rate) of webapp/public/data/showcase/comeback_atlas.json cells lead_+01_05|rem_00_02|reg and lead_+05_10|rem_12_24|reg; not part of the main table, shown only as a cross-check.
The two checked cells do not agree to the same degree. The final-two-minutes cell agrees closely (1.29% versus 1.35%), expected since with almost no time left the result is close to locked in regardless of which side is at home. The 12-24-minutes-left cell shows a wider gap (29.77% versus 25.01%) on comparable game counts (615 versus 736); this is consistent with, but does not prove, a genuine difference between a home and an away side's come-back chances at that same deficit and time -- separating a home-court effect from sampling variation would need a dedicated home-versus-away contrast, which neither this atlas nor this paper attempts.
This would be revised if a wider, non-masked reading of the 20-30 and 30-plus point bands (all four smallest cells are masked or in the teens on n_games) showed a rate meaningfully above zero once more games clear the floor, or if a later corpus moved the 1-5-point, final-two-minutes rate materially away from 1.29% (n=348), since that cell carries much of this paper's 'still close' versus 'over' contrast.
This paper covers the NBA only, because the source module's cells are built from an NBA-specific reliability map. The blowout_dynamics module cited above measures a persistence question on different sports, with clock units never pooled; it shows only that 'once a margin gets big, is the game over' has been asked two ways here, from two artifacts whose answers are not interchangeable.
6 Limitations
- Each cell's rate is a tick-weighted mean of the final outcome, not a game-weighted mean; a game that spends many recorded ticks in a cell counts more toward that cell's rate than a game passing through briefly, so the reported frequency is not simply 'the fraction of games' in the everyday sense.
- The main table's 'trailing side' is specifically the home side while behind, following the source's own sign convention; the mirrored away-trailing states exist in the same artifact but are used here only for a two-cell robustness check, not merged into the headline table.
- Four of the 46 cells in the main table (and three more among the mirrored positive-lead cells) sit below the source's own 30-game floor; their raw counts are reported but no rate is read from them, and three deficit bands have no recorded overtime cell at all.
- This is a historical frequency table built from realized outcomes across many different games sharing a deficit-and-time label; it is not a live forecast, a calibrated model, or a price for any specific ongoing game, and it applies no adjustment for team strength, opponent quality, or which teams are involved.
- Only one corpus snapshot is reported, as of 2026-09-17; there is no walk-forward or multi-season replication here showing these rates are stable across seasons.
- This paper covers the NBA only; the source module carries no MLB, soccer, or tennis cells, and the blowout_dynamics contrast referenced above measures a different question on different sports and is not a like-for-like comparison.
- comeback_atlas.json's 2026-09-17 re-run on the segment-clean roots reproduced every cell here unchanged, because its corpus is the NBA reliability map rather than the re-segmented in-game join; neither it nor blowout_dynamics.json is under review.
7 How to read this on the site
The comeback_atlas module page renders the same published cells this paper reads from, including its masked-cell markers. The comeback-rates-deficit-time analysis restates each source cell as a derived come-back share (1 - the published leading-side rate) alongside its game and tick support -- the same complement logic used above, applied across the whole grid rather than to two cells.
Readers who want the persistence-of-a-margin framing should go to the blowout-timing inspector, which renders blowout_dynamics's MLB and international-soccer point-of-no-return timing referenced above. The state-contrasts inspector carries a related but distinct between-state comparison; neither inspector's numbers restate this paper's come-back frequencies, and this paper's numbers should not be read back into either of them.
Evidence
- comeback_atlas.jsonas_of 2026-09-17Source path: /analytics/m/comeback_atlas/
Evidence field inventory (48 paths)
- as_of
- corpus
- source
- source_honest_note
- mask_rule
- n_buckets_total
- n_buckets_masked_n_lt_30
- n_buckets_unmasked
- novelty.verdict
- novelty.closest_prior_work
- novelty.how_ours_differs
- story
- cells[].lead_band
- cells[].time_band
- cells[].n_games
- cells[].n_ticks
- cells[].outcome_rate
- cells[].masked_n_lt_30
- cells[bucket=lead_00|ot|ot].n_games
- cells[bucket=lead_00|ot|ot].outcome_rate
- cells[bucket=lead_00|rem_00_02|reg].n_games
- cells[bucket=lead_00|rem_00_02|reg].outcome_rate
- cells[bucket=lead_-01_05|rem_36_99|reg].n_games
- cells[bucket=lead_-01_05|rem_36_99|reg].outcome_rate
- cells[bucket=lead_-01_05|rem_00_02|reg].n_games
- cells[bucket=lead_-01_05|rem_00_02|reg].n_ticks
- cells[bucket=lead_-01_05|rem_00_02|reg].outcome_rate
- cells[bucket=lead_-01_05|ot|ot].n_games
- cells[bucket=lead_-01_05|ot|ot].outcome_rate
- cells[bucket=lead_-05_10|rem_00_02|reg].n_games
- cells[bucket=lead_-05_10|rem_00_02|reg].n_ticks
- cells[bucket=lead_-05_10|rem_00_02|reg].outcome_rate
- cells[bucket=lead_-10_15|ot|ot].n_games
- cells[bucket=lead_-10_15|ot|ot].masked_n_lt_30
- cells[bucket=lead_-20_30|rem_36_99|reg].n_games
- cells[bucket=lead_-20_30|rem_36_99|reg].outcome_rate
- cells[bucket=lead_-20_30|rem_36_99|reg].masked_n_lt_30
- cells[bucket=lead_-30_99|rem_24_36|reg].n_games
- cells[bucket=lead_-30_99|rem_24_36|reg].masked_n_lt_30
- cells[bucket=lead_-30_99|rem_36_99|reg].n_games
- cells[bucket=lead_-30_99|rem_36_99|reg].n_ticks
- cells[bucket=lead_-30_99|rem_36_99|reg].masked_n_lt_30
- cells[bucket=lead_-30_99|rem_00_02|reg].n_games
- cells[bucket=lead_-30_99|rem_00_02|reg].outcome_rate
- cells[bucket=lead_+01_05|rem_00_02|reg].n_games
- cells[bucket=lead_+01_05|rem_00_02|reg].outcome_rate
- cells[bucket=lead_+05_10|rem_12_24|reg].n_games
- cells[bucket=lead_+05_10|rem_12_24|reg].outcome_rate
- blowout_dynamics.jsonas_of 2026-09-17Source path: /analytics/m/blowout_dynamics/
Evidence field inventory (11 paths)
- as_of
- corpus
- method
- floors.min_ticks_per_game
- floors.min_games_per_threshold
- sports.mlb.thresholds[threshold=2].decided_frac_of_games
- sports.mlb.thresholds[threshold=2].n_games_decided
- sports.mlb.thresholds[threshold=2].n_games_total
- sports.soccer_intl.thresholds[threshold=1].decided_frac_of_games
- sports.soccer_intl.thresholds[threshold=1].n_games_decided
- sports.soccer_intl.thresholds[threshold=1].n_games_total