Comeback atlas: where the model nails the game state
For a 1-to-5 point lead with 24-36 minutes left, the model's mean win probability is 0.6204 across 898 games and teams in that state actually won 62.03% of the time -- a near-perfect calibration match.
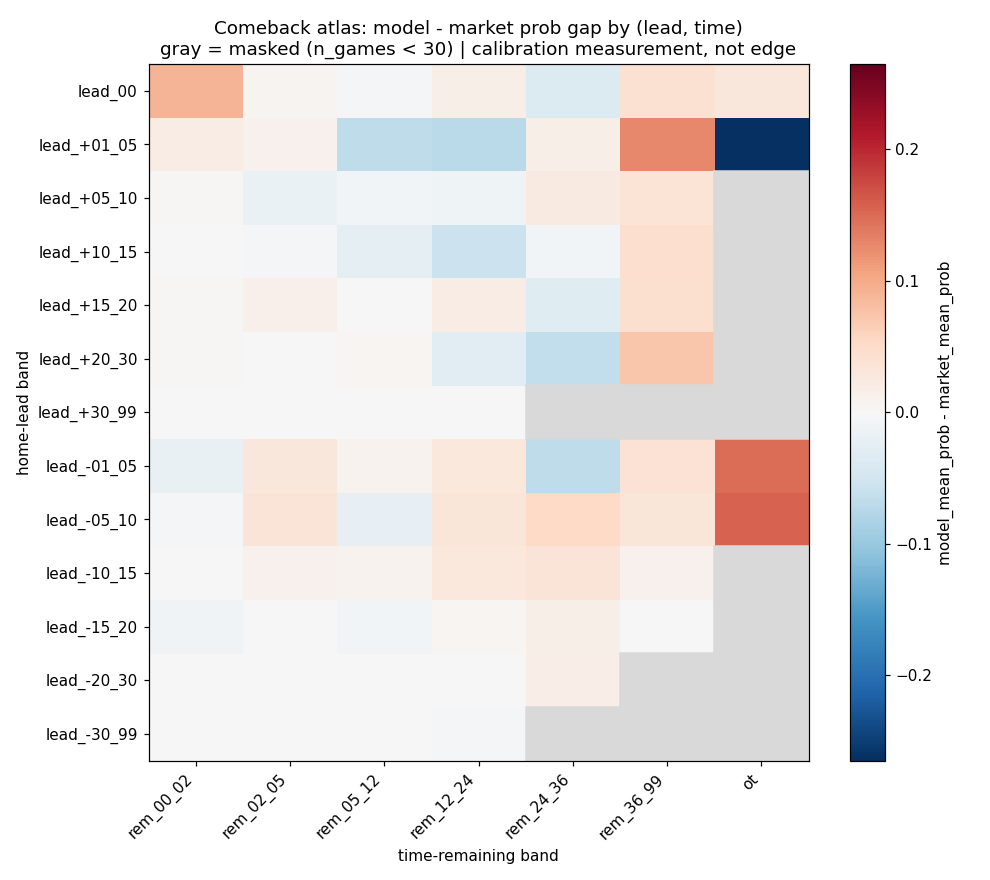
How to read this figure
Each cell compares model_mean_prob, market_mean_prob, and outcome_rate for a bucket; buckets with fewer than 30 games are masked from the headline but still listed.
Continue with the data
Open the interactive analysis: Comeback rates by deficit and time remainingWhat it means
The reliability map is reshaped into a lead-by-time-remaining atlas of 84 game-state buckets, each carrying the model's win probability, the in-play market price, and the realized outcome frequency. In the bulk of regulation states the model tracks reality closely, like the 1-5 point early lead above. The honest exception is overtime: with a 1-5 lead in OT the model says 0.7113 while teams actually won 98.3% and the market priced 97.6% -- the model under-rates how decisive a late lead is, and the market is better there.
Caveats and confounds
Calibration/reliability measurement. Buckets below 30 games are masked; the widest gaps sit in thin overtime cells. This atlas reads the NBA reliability map, not the MLB and soccer in-game join, so the 2026-09 segmentation of that join could not move it; re-running it on the segmented roots on 2026-09-17 reproduced all 84 buckets exactly.