MLB calibration is improving month over month -- but still trails the market
The MLB model's calibration error fell from 0.1265 in June to 0.075 in July, yet the market stayed sharper in both months (0.121, then 0.0439).
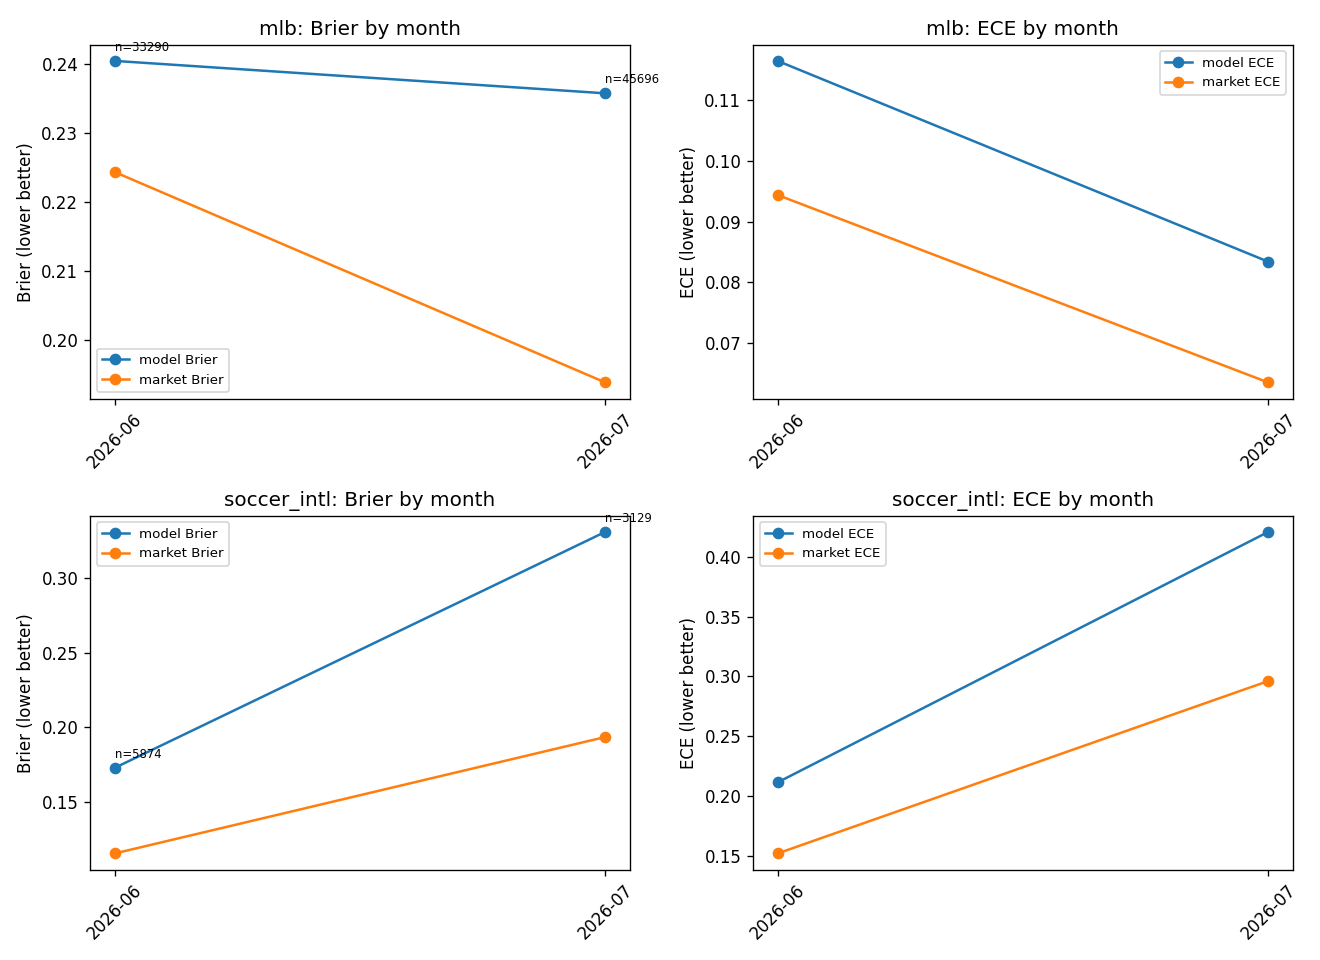
How to read this figure
Each cell is one sport-month; lower Brier and ECE are better, and the honest comparison is the model row against the market row within the same month.
Continue with the data
Open the interactive analysis: Observed monthly calibration shiftWhat it means
Splitting the record by calendar month checks whether the model is stable or drifting. MLB is encouraging -- the model got better-calibrated as July games came in (ECE 0.1265 to 0.075) -- but the market improved faster and kept its lead. Soccer stayed poor in both months: the model's monthly Brier was 0.3273 in June and 0.3346 in July, against a market at 0.1955 and 0.195.
Caveats and confounds
The June MLB month rests on only n=5030 rows and July soccer on n=3052 rows after segmentation, so the monthly split is thin at both ends.