Context splits: even the streakiest scorers barely move
Descriptive only
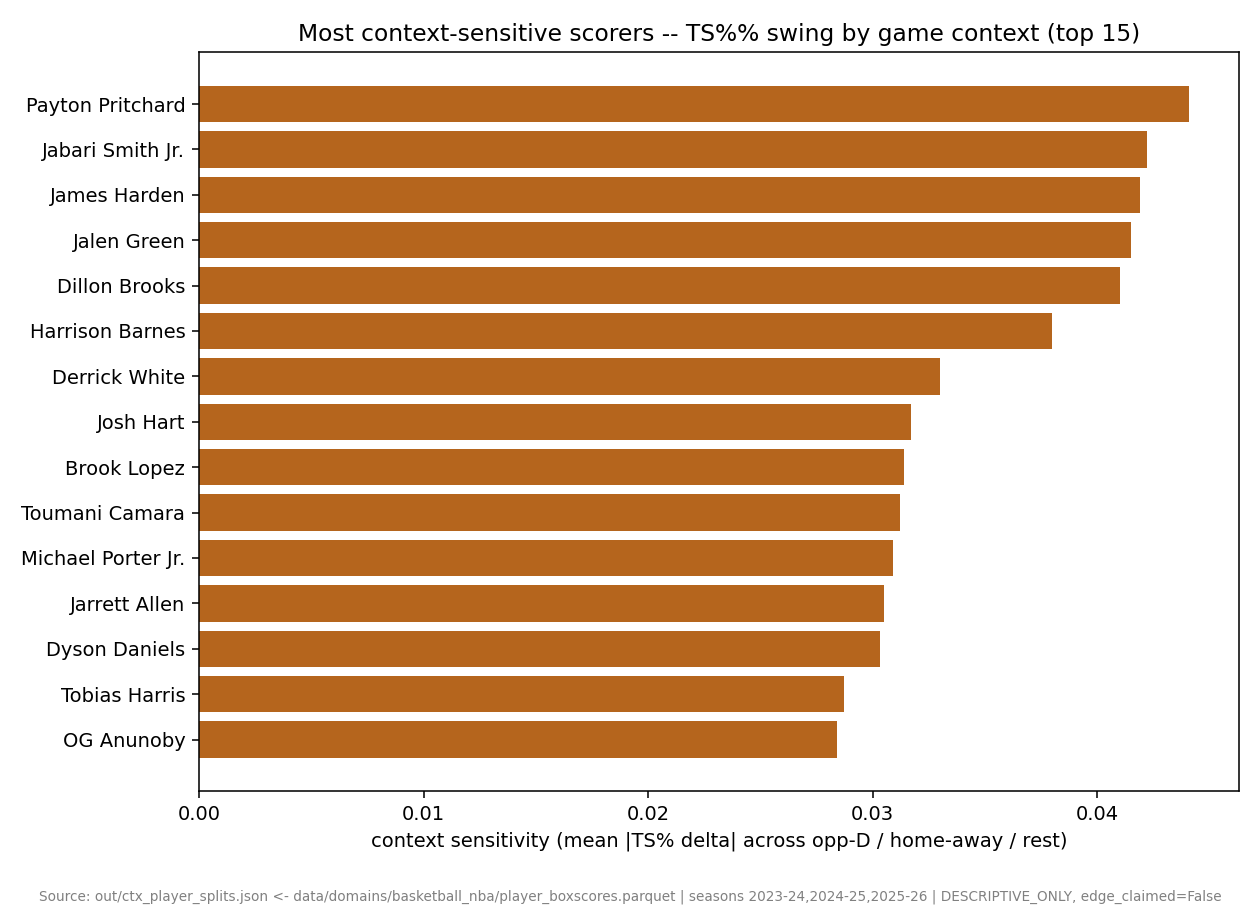
How to read this figure
context_sensitivity_score is the mean absolute TS% gap across the three dimensions; the per-dimension delta_ts_pct fields show which split drives it.
Continue with the data
Open the interactive analysis: Which observed context has the widest TS% gap?What it means
Each player's efficiency is sliced three ways -- top-10 vs bottom-10 defenses, home vs away, and back-to-back vs rested -- to see whose shooting is most schedule-dependent. The headline is how little moves: the single most context-sensitive of the league's workhorses averages a ~4-point TS swing, and most of the top 50 sit lower. Player efficiency is far stickier across context than the 'he's a road warrior / he feasts on tired legs' narratives suggest.
Caveats and confounds
Descriptive only: cells below 10 player-games are dropped as insufficient, first games of a team-season have unknown rest, and no opponent/lineup adjustment is applied -- raw split dispersion only, not a causal finding.